. 2006 Oct;18(10):1758-68.
doi: 10.1016/j.cellsig.2006.01.016. Epub 2006 Mar 6.

G protein betagamma complex translocation from plasma membrane to Golgi complex is influenced by receptor gamma subunit interaction

Affiliations

G protein betagamma complex translocation from plasma membrane to Golgi complex is influenced by receptor gamma subunit interaction

Muslum Akgoz et al. Cell Signal. 2006 Oct.

Abstract

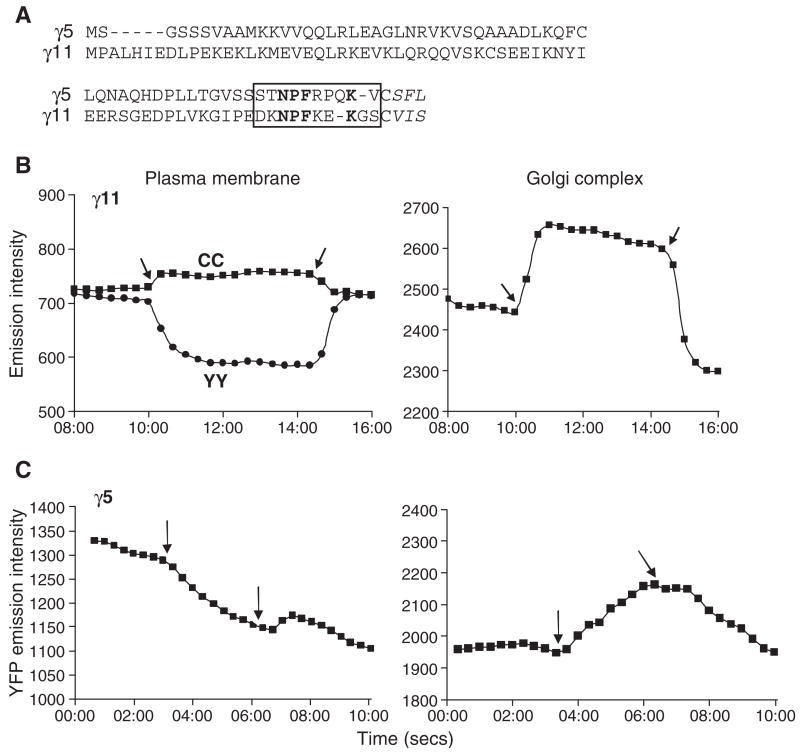
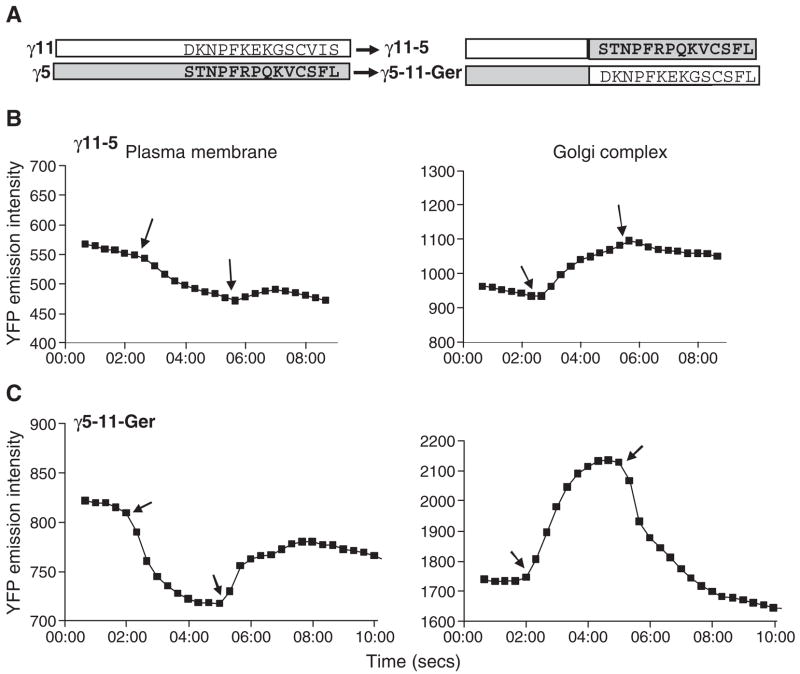
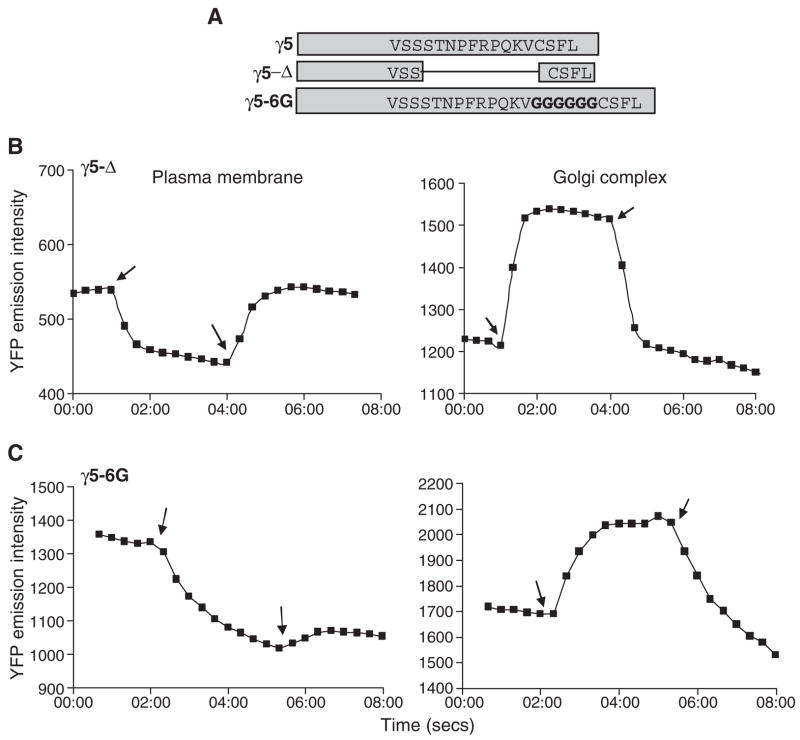
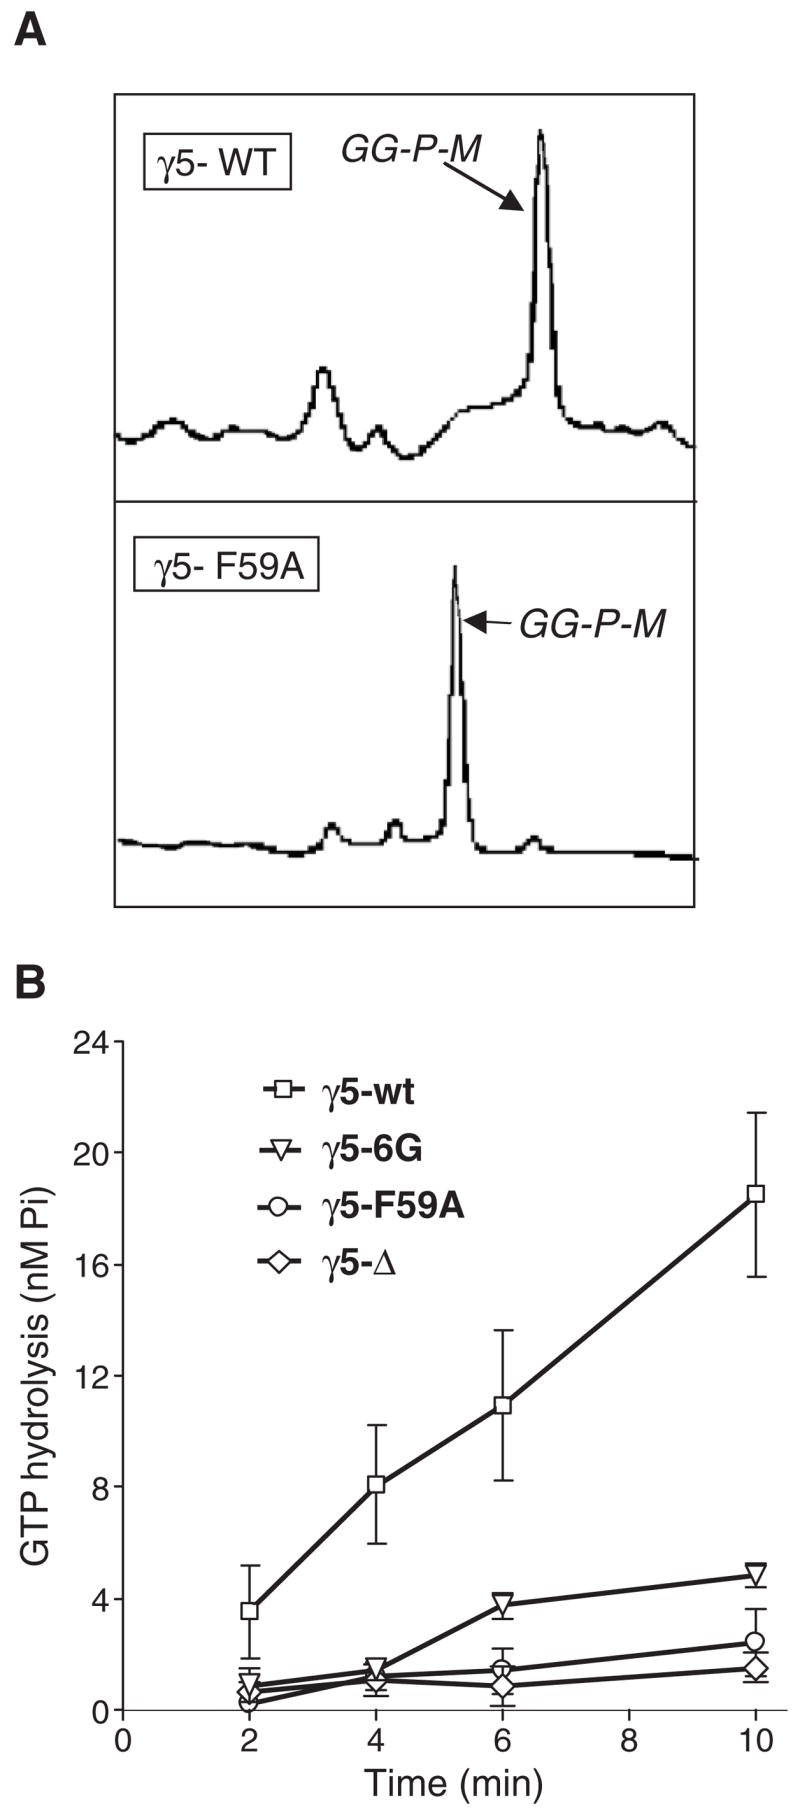
On activation of a receptor the G protein betagamma complex translocates away from the receptor on the plasma membrane to the Golgi complex. The rate of translocation is influenced by the type of gamma subunit associated with the G protein. Complementary approaches--imaging living cells expressing fluorescent protein tagged G proteins and assaying reconstituted receptors and G proteins in vitro--were used to identify mechanisms at the basis of the translocation process. Translocation of Gbetagamma containing mutant gamma subunits with altered prenyl moieties showed that the differences in the prenyl moieties were not sufficient to explain the differential effects of geranylgeranylated gamma5 and farnesylated gamma11 on the translocation process. The translocation properties of Gbetagamma were altered dramatically by mutating the C terminal tail region of the gamma subunit. The translocation characteristics of these mutants suggest that after receptor activation, Gbetagamma retains contact with a receptor through the gamma subunit C terminal domain and that differential interaction of the activated receptor with this domain controls Gbetagamma translocation from the plasma membrane.


Figures

Fig. 1
Fig. 1
Translocation of two different γ subunit types. (A) Comparison of the primary structures of the γ5 and γ11 subunit types. The CAAX sequence is post-translationally processed such that the Cys is prenylated, the AAX sequence is proteolytically removed and the carboxyl end methylated [41]. γ5 is geranylgeranylated and γ11 is farnesylated [17]. The C terminal domain that was mutated or exchanged in experiments below is in a box. Conserved residues in grey box are in bold. Time course of the grey scale intensities from the plasma membrane and Golgi regions of M2-CHO cells expressing αo-CFP, β1 and YFP-γ11 (B) or YFP-γ5 (C). In (B) agonist was added after about 10min compared to all other experiments where it was after about 2min. CC is the CFP emission acquired on excitation of CFP. YY is YFP emission acquired on YFP excitation. Arrows indicate time points at which first, agonist and second, antagonist were added sequentially here and in all similar plots below. Plots are scaled to the same time intervals. Agonist: 100μM carbachol and antagonist: 100μM or 1mM atropine. Experiments were performed as described in the Experimental procedures section. Representative plots (n≥4).
Fig. 2
Fig. 2
Images of agonist and antagonist treated live cells expressing YFP tagged wild type and mutant γ5 subunits. The γ subunit fusions were coexpressed with αo-CFP and β1. Arrows highlight YFP emission signals on the plasma membrane that show significant changes after agonist or antagonist addition. Details are in the Experimental procedures section. Images are representative. There is a reduction in YFP signal over time due to bleaching especially in the case of γ11 because of a lengthy delay in the acquisition of images after agonist and antagonist addition.
Fig. 3
Fig. 3
Translocation of two different γ subunit mutants with altered prenyl modifications. (A) Diagrammatic representation of the γ5 and γ11 mutant subunits. Time course of the grey scale intensities from the plasma membrane and Golgi regions of M2-CHO cells expressing αo-CFP, β1 and YFP-γ5-farnesylated (γ5-Far) (B) or YFP-γ11-geranylgeranylated (γ11-Ger) (C). Arrows indicate time points at which agonist and antagonist were added sequentially. Agonist: 100μM carbachol and antagonist: 100μM or 1mM atropine. Experiments were performed as above. Representative plots (n≥4).
Fig. 4
Fig. 4
Translocation of two different γ subunit chimeras with switched C terminal domains. (A) Diagrammatic representations of the γ11-5 and γ5-11-Ger chimeric subunits. γ11-5 is a γ11 chimera containing the last fourteen residues of γ5 substituted for the last fourteen residues of γ11. γ5-11-Ger is a γ5 chimera containing the ten residues of γ11 upstream of the CAAX box substituted for the ten residues upstream of the CAAX box of γ5. It contains the CAAX box of γ5 so it is geranylgeranylated. Time courses of the grey scale intensities from the plasma membrane and Golgi regions of M2-CHO cells expressing αo-CFP, β1 and YFP-γ11-5 (γ11-5) (B) or YFP-γ5-11-Ger (γ5-11-Ger) (C). Arrows indicate time points at which agonist and antagonist were added sequentially. Agonist: 100μM carbachol and antagonist: 100μM or 1mM atropine. Experiments were performed as above. Representative plots (n≥4).
Fig. 5
Fig. 5
Translocation of mutant γ5 subunits with altered C terminal tail domains. (A) Diagrammatic representation of the γ5-Δ and γ5-6G mutants. (B) Time course of the grey scale intensities from the plasma membrane and Golgi regions of M2-CHO cells expressing αo, β1 and YFP-γ5-Δ (γ5-Δ). (C) Time course of the grey scale intensities from the plasma membrane and Golgi regions of M2-CHO cells expressing αo-CFP, β1 and YFP-γ5-6G (γ5-6G). Arrows indicate time points at which agonist and antagonist were added sequentially. Agonist: 100μM carbachol and antagonist: 100μM or 1mM atropine. Experiments were performed as above. Representative plots (n≥4).
Fig. 6
Fig. 6
Translocation of the γ5-F59A mutant. (A) The crystal structure of the G protein β1γ1 complex [31] shows that the γ1 F64 residue which is homologous to F59 of γ5 is buried in a cavity in the β subunit. (B) A single point mutation in γ5 substitutes F59 with A. (C) Time course of the grey scale intensities from the plasma membrane and Golgi regions of M2-CHO cells expressing αo-CFP, β1 and YFP-γ5-F59A (γ5-F59A). Arrows indicate time points at which agonist and antagonist were added sequentially. Agonist: 100μM carbachol and antagonist: 100μM or 1mM atropine. Experiments were performed as above. Representative plots (n≥4).
Fig. 7
Fig. 7
Receptor stimulated GTPase activity of Go containing various γ5 mutants. (A) Chromatographic traces of γ5 wild type and γ5-F59A mutant from a HPLC column showing that both proteins are highly purified. The peaks labeled GG-P-M were geranylgeranylated, proteolyzed and methylated as determined by mass spectrometry. (B) M2 stimulated GTPase activity in a reconstituted system containing the purified receptor, G protein subunits and RGS protein. Bars represent SEM (n=3–4). Details of the methods are in the text.

References

    1. Hou Y, Chang V, Capper AB, Taussig R, Gautam N. J Biol Chem. 2001;276(23):19982. - PubMed
    1. Gibson SK, Gilman AG. Proc Natl Acad Sci U S A. 2005;103(1):212. - PMC - PubMed
    1. McIntire WE, MacCleery G, Garrison JC. J Biol Chem. 2001;276(19):15801. - PubMed
    1. Lim WK, Myung CS, Garrison JC, Neubig RR. Biochemistry. 2001;40(35):10532. - PubMed
    1. Richardson M, Robishaw JD. J Biol Chem. 1999;274(19):13525. - PubMed

Publication types

MeSH terms

Substances