. 2006 Mar;72(3):1997-2004.
doi: 10.1128/AEM.72.3.1997-2004.2006.

Selective removal of DNA from dead cells of mixed bacterial communities by use of ethidium monoazide

Affiliations

Selective removal of DNA from dead cells of mixed bacterial communities by use of ethidium monoazide

Andreas Nocker et al. Appl Environ Microbiol. 2006 Mar.

Abstract

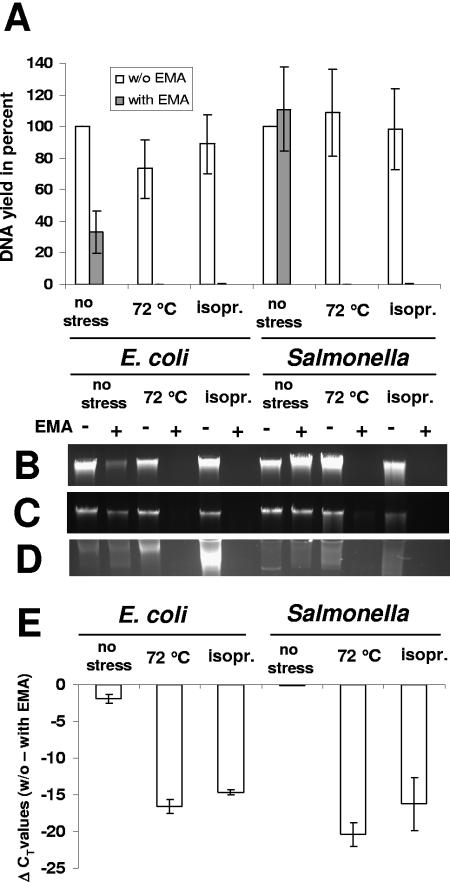
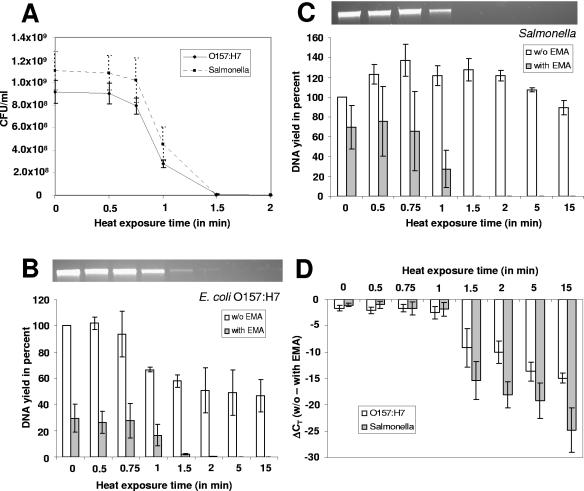
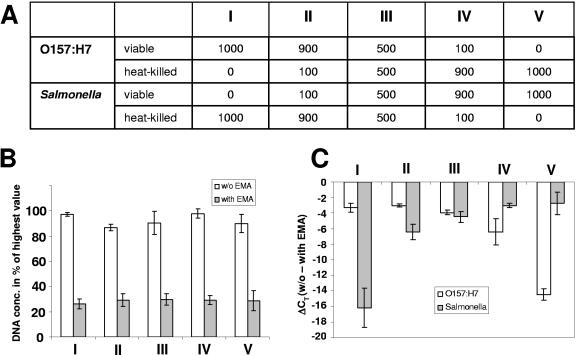
The distinction between viable and dead bacterial cells poses a major challenge in microbial diagnostics. Due to the persistence of DNA in the environment after cells have lost viability, DNA-based quantification methods overestimate the number of viable cells in mixed populations or even lead to false-positive results in the absence of viable cells. On the other hand, RNA-based diagnostic methods, which circumvent this problem, are technically demanding and suffer from some drawbacks. A promising and easy-to-use alternative utilizing the DNA-intercalating dye ethidium monoazide bromide (EMA) was published recently. This chemical is known to penetrate only into "dead" cells with compromised cell membrane integrity. Subsequent photoinduced cross-linking was reported to inhibit PCR amplification of DNA from dead cells. We provide evidence here that in addition to inhibition of amplification, most of the DNA from dead cells is actually lost during the DNA extraction procedure, probably together with cell debris which goes into the pellet fraction. Exposure of bacteria to increasing stress and higher proportions of dead cells in defined populations led to increasing loss of genomic DNA. Experiments were performed using Escherichia coli O157:H7 and Salmonella enterica serovar Typhimurium as model pathogens and using real-time PCR for their quantification. Results showed that EMA treatment of mixed populations of these two species provides a valuable tool for selective removal of DNA of nonviable cells by using conventional extraction protocols. Furthermore, we provide evidence that prior to denaturing gradient gel electrophoresis, EMA treatment of a mature mixed-population drinking-water biofilm containing a substantial proportion of dead cells can result in community fingerprints dramatically different from those for an untreated biofilm. The interpretation of such fingerprints can have important implications in the field of microbial ecology.


Figures

FIG. 1.
FIG. 1.
Effects of stress and EMA treatment on genomic DNA yield and Q-PCR signal thresholds of E. coli O157:H7 and Salmonella serovar Typhimurium. Cultures were either processed directly without stress exposure, heat treated at 72°C for 5 min, or exposed to 70% isopropanol (isopr.) for 10 min. Error bars, standard deviations from three independent replicates. (A) Genomic DNA yields of unstressed and stress-killed cells without EMA (white bars) and with EMA (gray bars) treatment, expressed as percentages of the DNA yields of the corresponding unstressed and non-EMA-treated cultures. Genomic DNA was extracted using the Qbiogene soil kit. (B to D) Stained agarose gels showing genomic DNA from the same treatments. DNA was extracted using the Qbiogene soil kit (B), the DNeasy tissue kit (C), or the PrepMan Ultra sample preparation reagent (D). (E) Signal reduction as determined by Q-PCR detecting relative differences in stx1 (E. coli O157:H7) and invA (Salmonella) gene copies. CT values derived from EMA-treated cultures were subtracted from the corresponding CT values for untreated cultures.
FIG. 2.
FIG. 2.
Effects of increasingly long heat stress exposures at 72°C on E. coli O157:H7 and Salmonella. Error bars, standard deviations from three independent replicates. (A) Loss of viability with increasing exposure times as determined by plate counts. (B and C) Effects of prolonged heat stress and EMA treatment on the DNA yields of E. coli O157:H7 (B) and Salmonella (C). Yields are expressed as percentages of the yield obtained with an unstressed and non-EMA-treated culture. Genomic DNA from EMA-treated aliquots was also visualized on agarose gels. (D) Signal reduction was determined by Q-PCR detecting relative differences in stx1 (E. coli O157:H7) and invA (Salmonella) gene copies. CT values derived from EMA-treated cultures were subtracted from corresponding CT values from untreated cultures.
FIG. 3.
FIG. 3.
Effect of EMA treatment on genomic DNA yield and PCR quantification of defined ratios of viable and heat-killed cells. Error bars, standard deviations from three independent replicates. (A) Table showing mixing ratios of viable and heat-killed E. coli O157:H7. Numbers represent volumes in microliters. Every mixture was supplemented with 50 μl of E. coli Mach1-T1R carrying a pCR2.1 plasmid as an amplification control. (B) Genomic DNA yield expressed as a percentage of the concentration obtained from mixture VI. The DNA was also visualized on an agarose gel (top). (C) Real-time PCR was performed using primers specific for the stx1 gene and M13 primers amplifying an internal vector sequence. CT values of the stx1 and M13 (control) amplifications are shown as a function of the normalized total DNA concentration. (D) Correlation between the natural logarithm of the normalized DNA concentrations and the corresponding CT values obtained from stx1 amplification. The R2 value of the linear trendline is given.
FIG. 4.
FIG. 4.
Effect of EMA on the amplification of defined two-species mixtures with different ratios of viable and heat-killed cells. Error bars, standard deviations from three independent replicates. (A) Table showing mixing ratios of viable and heat-killed E. coli O157:H7 and Salmonella. Numbers represent volumes in microliters. (B) Genomic DNA yields expressed as percentages of the highest value obtained. (C) Signal reduction as determined by Q-PCR detecting relative differences in stx1 (E. coli O157:H7) and invA (Salmonella) gene copies. CT values derived from EMA-treated cultures were subtracted from the corresponding CT values from untreated cultures.
FIG. 5.
FIG. 5.
Effect of EMA treatment on community fingerprints of a mature drinking-water biofilm and qualitative viability analysis of the same biofilm. (A) Community patterns derived from an untreated (left) and an EMA-treated but otherwise identical (right) biofilm by using denaturing gradient gel electrophoresis. (B) BacLight LIVE/DEAD viability staining. Dead cells were stained red or orange with propidium iodide, while live cells were stained green with SYTO 9. Yellow color indicates simultaneous binding of both dyes (most probably to a debris particle).

Comment in

References

    1. Alifano, P., C. B. Bruni, and M. S. Carlomagno. 1994. Control of mRNA processing and decay in prokaryotes. Genetica 94:157-172. - PubMed
    1. Belasco, J. 1993. mRNA degradation in prokaryotic cells: an overview, p. 3-12. In J. Belasco and G. Brawerman (ed.), Control of messenger RNA stability. Academic Press, Inc., San Diego, Calif.
    1. Bolton, P. H., and D. R. Kearns. 1978. Spectroscopic properties of ethidium monoazide: a fluorescent photoaffinity label for nucleic acids. Nucleic Acids Res. 5:4891-4903. - PMC - PubMed
    1. Breeuwer, P., and T. Abee. 2000. Assessment of viability of microorganisms employing fluorescence techniques. Int. J. Food Microbiol. 55:193-200. - PubMed
    1. Coffman, G. L., J. W. Gaubatz, K. L. Yielding, and L. W. Yielding. 1982. Demonstration of specific high affinity binding sites in plasmid DNA by photoaffinity labeling with ethidium analog. J. Biol. Chem. 257:13205-13297. - PubMed

Publication types

MeSH terms