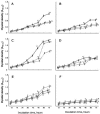
Global carbon utilization profiles of wild-type, mutant, and transformant strains of Hypocrea jecorina
- PMID: 16517662
- PMCID: PMC1393202
- DOI: 10.1128/AEM.72.3.2126-2133.2006
Global carbon utilization profiles of wild-type, mutant, and transformant strains of Hypocrea jecorina
Abstract
The ascomycete Hypocrea jecorina (Trichoderma reesei), an industrial producer of cellulases and hemicellulases, can efficiently degrade plant polysaccharides. However, the catabolic pathways for the resulting monomers and their relationship to enzyme induction are not well known. Here we used the Biolog Phenotype MicroArrays technique to evaluate the growth of H. jecorina on 95 carbon sources. For this purpose, we compared several wild-type isolates, mutants producing different amounts of cellulases, and strains transformed with a heterologous antibiotic resistance marker gene. The wild-type isolates and transformed strains had the highest variation in growth patterns on individual carbon sources. The cellulase mutants were relatively similar to their parental strains. Both in the mutant and in the transformed strains, the most significant changes occurred in utilization of xylitol, erythritol, D-sorbitol, D-ribose, D-galactose, L-arabinose, N-acetyl-D-glucosamine, maltotriose, and beta-methyl-glucoside. Increased production of cellulases was negatively correlated with the ability to grow on gamma-aminobutyrate, adonitol, and 2-ketogluconate; and positively correlated with that on d-sorbitol and saccharic acid. The reproducibility, relative simplicity, and high resolution (+/-10% of increase in mycelial density) of the phenotypic microarrays make them a useful tool for the characterization of mutant and transformed strains and for a global analysis of gene function.
Figures


References
-
- Ausubel, F. M., R. Brent, R. E. Kingston, D. D. Moore, J. G. Seidman, J. A. Smith, and K. Stuhl. 2003. Current protocols in molecular biology. Greene Publishing Associates/Wiley Interscience, New York, N.Y.
-
- Bochner, B. R. 2003. New technologies to assess genotype-phenotype relationships. Nat. Rev. Genet. 4:309-314. - PubMed
-
- Cakar, Z. P., U. Sauer, and J. E. Bailey. 1999. Metabolic engineering of yeasts: the peril of auxotrophic hosts. Biotechnol. Lett. 21:611-616.
-
- Chambergo, F. S., E. D. Bonaccorsi, A. J. Ferreira, A. S. Ramos, J. R. Ferreira Junior, J. Abrahao-Neto, J. P. Farah, and H. El-Dorry. 2002. Elucidation of the metabolic fate of glucose in the filamentous fungus Trichoderma reesei using expressed sequence tag (EST) analysis and cDNA microarrays. J. Biol. Chem. 277:13983-13988. - PubMed
Publication types
MeSH terms
Substances
LinkOut - more resources
Full Text Sources

