. 2006 Mar 6:6:5.
doi: 10.1186/1475-2867-6-5.

Colocalization of somatostatin receptors and epidermal growth factor receptors in breast cancer cells

Affiliations

Colocalization of somatostatin receptors and epidermal growth factor receptors in breast cancer cells

Heather L Watt et al. Cancer Cell Int. .

Abstract

Background: Somatostatin receptor (SSTR) expression is positively correlated with tumor size and inversely correlated with epidermal growth factor receptor (ErbB) levels and tumor differentiation. In the present study, we compared SSTR1-5 and ErbB1-4 mRNA and protein expression in two breast cancer cell lines: MCF-7 (ER+) and MDA-MB-231 (ERalpha-).

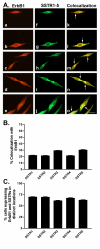
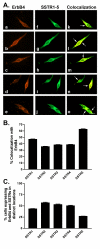
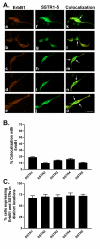
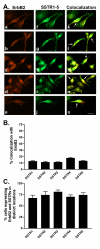
Results: All five SSTRs and four ErbBs were variably expressed as both cell surface and cytoplasmic proteins. In both cell lines, SSTR4 and SSTR1 were highly expressed, followed by SSTR2 and SSTR5 with SSTR3 being the least expressed subtype, at the protein level. ErbBs were variably expressed with ErbB1 as the predominant subtype in both cell lines. ErbB1 is followed by ErbB3, ErbB2 and ErbB4 in MCF-7 at both the protein and mRNA levels. In MDA-MB-231 cells, ErbB1 is followed by ErbB2, ErbB4 and ErbB3. Our results indicate significant correlations at the level of mRNA and protein expression in a cell and receptor-specific manner. Using indirect immunofluorescence, we found that, in MCF-7 cells, SSTR5 was the most prominent subtype coexpressed with ErbBs followed by SSTR3, SSTR4, SSTR1 and SSTR2, respectively. In MDA-MB-231 cells, SSTR1 colocalized strongly with ErbBs followed by SSTR5, SSTR4, SSTR3 and SSTR2. ErbBs displayed higher levels of colocalization amongst themselves in MCF-7 cells than in MDA-MB-231 cells.

Conclusion: These findings may explain the poor response to endocrine therapy in ER-cancer. Differential distribution of SSTR subtypes with ErbBs in breast cancer cells in a receptor-specific manner may be considered as a novel diagnosis for breast tumors.


Figures

Figure 1
Figure 1
Semi-quantitative analysis of SSTR1-5 and ErbB1-4 mRNA and protein expression in MCF-7 and MDA-MB-231 breast cancer cells. A. Upper panel shows western blot analysis of SSTR1-5 in MCF-7 (left) and MDA-MB-231 (right) cells. Membrane protein (25 μg) was fractionated by SDS-PAGE and probed with affinity-purified SSTR antibodies. Major protein bands of 53 (SSTR1), 57 (SSTR2), 60 (SSTR3), 44 (SSTR4) and 58 kDa (SSTR5) were obtained. Lower panel shows RT-PCR anlaysis of SSTR1-5 mRNA expression in both cell lines. 5 μg of DNA-free RNA was reverse transcribed and coamplified with primers specific for SSTR1-5 and β-actin. 8 μL of PCR products were fractionated on agarose gels stained with ethidium bromide, visualized under UV lighting and photographed. B. Western blot (upper panel) and RT-PCR (lower panel) analysis of ErbB1-4 expression in MCF-7 (left) and MDA-MB-231 (right) breast tumor cells. Major protein bands of 170 (ErbB1), 185 (ErbB2), 200 (ErbB3) and 175 kDa (ErbB4) were obtained. Experimental conditions were the same as described for panel A except for the specific antibodies and primers.
Figure 2
Figure 2
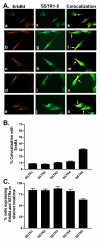
A. Representative photomicrographs illustrating double immunofluorescence localization of ErbB1 and SSTR1-5 in MCF-7 cells. Localization of ErbB1 (red staining) was visualized using monoclonal antibodies with Cy3-conjugated goat anti-mouse IgG (a-e). The same cells were incubated with polyclonal SSTR1-5 antibodies and visualized (green staining) using FITC-conjugated goat anti-rabbit IgG (f-j). Colocalization of ErbB1 and SSTR1-5 was determined by merging individual red and green images to give orange-labelled cells (k-o). All receptors are expressed as membrane and cytoplasmic protein. Arrows indicate colocalization at the cell surface. Scale bar = 25 μm. B. Quantitative analysis of MCF-7 cells showing colocalization of ErbB1 with SSTR1-5. Cells expressing two receptors together were counted from at least 8 randomly selected vertical and horizontal fields from each coverslip. Data are from three different experiments performed in duplicate and are presented as mean ± SEM for each receptor combination. C. Quantitative analysis of cells showing ErbB1 and SSTR1-5 in distinct locations within the same cell. Data were analyzed as described in B.
Figure 3
Figure 3
A. Representative photomicrographs illustrating double immunofluorescence localization of ErbB2 (red staining) and SSTR1-5 (green staining) in MCF-7 cells (for details see legend to Figure 2). Scale bar = 25 μm. B. Quantitative analysis of MCF-7 cells showing colocalization of ErbB2 with SSTR1-5 (for details see legend to Figure 2). C. Quantitative analysis of cells showing ErbB2 and SSTR1-5 in distinct locations within the same cell. Data were analyzed as described in Figure 2.
Figure 4
Figure 4
A. Representative photomicrographs illustrating double immunofluorescence localization of ErbB3 (red staining) and SSTR1-5 (green staining) in MCF-7 cells (for details see legend to Figure 2). Scale bar = 25 μm. B. Quantitative analysis of MCF-7 cells showing colocalization of ErbB3 with SSTR1-5 (for details see legend to Figure 2). C. Quantitative analysis of cells showing ErbB3 and SSTR1-5 in distinct locations within the same cell. Data were analyzed as described in Figure 2.
Figure 5
Figure 5
A. Representative photomicrographs illustrating double immunofluorescence localization of ErbB4 (red staining) and SSTR1-5 (green staining) in MCF-7 cells (for details see legend to Figure 2). Scale bar = 25 μm. B. Quantitative analysis of MCF-7 cells showing colocalization of ErbB4 with SSTR1-5 (for details see legend to Figure 2). C. Quantitative analysis of cells showing ErbB4 and SSTR1-5 in distinct locations within the same cell. Data were analyzed as described in Figure 2.
Figure 6
Figure 6
A. Representative photomicrographs illustrating double immunofluorescence localization of ErbB1 (red staining) and SSTR1-5 (green staining) in MDA-MB-231 cells (for details see legend to Figure 2). Scale bar = 25 μm. B. Quantitative analysis of MDA-MB-231 cells showing colocalization of ErbB1 with SSTR1-5 (for details see legend to Figure 2). C. Quantitative analysis of cells showing ErbB1 and SSTR1-5 in distinct locations within the same cell. Data were analyzed as described in Figure 2.
Figure 7
Figure 7
A. Representative photomicrographs illustrating double immunofluorescence localization of ErbB2 (red staining) and SSTR1-5 (green staining) in MDA-MB-231 cells (for details see legend to Figure 2). Scale bar = 25 μm. B. Quantitative analysis of MDA-MB-231 cells showing colocalization of ErbB2 with SSTR1-5 (for details see legend to Figure 2). C. Quantitative analysis of cells showing ErbB2 and SSTR1-5 in distinct locations within the same cell. Data were analyzed as described in Figure 2.
Figure 8
Figure 8
A. Representative photomicrographs illustrating double immunofluorescence localization of ErbB3 (red staining) and SSTR1-5 (green staining) in MDA-MB-231 cells (for details see legend to Figure 2). Scale bar = 25 μm. B. Quantitative analysis of MDA-MB-231 cells showing colocalization of ErbB3 with SSTR1-5 (for details see legend to Figure 2). C. Quantitative analysis of cells showing ErbB3 and SSTR1-5 in distinct locations within the same cell. Data were analyzed as described in Figure 2.
Figure 9
Figure 9
A. Representative photomicrographs illustrating double immunofluorescence localization of ErbB4 (red staining) and SSTR1-5 (green staining) in MDA-MB-231 cells (for details see legend to Figure 2). Scale bar = 25 μm. B. Quantitative analysis of MDA-MB-231 cells showing colocalization of ErbB4 with SSTR1-5 (for details see legend to Figure 2). C. Quantitative analysis of cells showing ErbB4 and SSTR1-5 in distinct locations within the same cell. Data were analyzed as described in Figure 2.
Figure 10
Figure 10
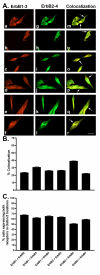
A. Representative photomicrographs illustrating double immunofluorescence localization of ErbB1-3 and ErbB2-4 in MCF-7 cells. Localization of ErbB1-3 (red staining) was visualized using monoclonal antibodies with Cy3-conjugated goat anti-mouse IgG (a-f). The same cells were incubated with polyclonal ErbB2-4 antibodies and visualized (green staining) using FITC-conjugated goat anti-rabbit (g-l). Colocalization of ErbB1-3 and ErbB2-4 was determined by merging individual red and green images to give orange-labelled cells (m-r). All receptors are expressed as membrane and cytoplasmic protein. Arrows indicate colocalization at the cell surface. Scale bar = 25 μm. B. Quantitative analysis of MCF-7 cells showing colocalization of ErbB1-3 with ErbB2-4 (for details see legend to Figure 2). C. Quantitative analysis of cells showing ErbB1-3 and ErbB2-4 in distinct locations within the same cell. Data were analyzed as described in Figure 2.
Figure 11
Figure 11
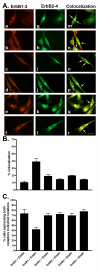
A. Representative photomicrographs illustrating double immunofluorescence localization of ErbB1-3 and ErbB2-4 in MDA-MB-231 cells (for details see legend to Figure 10). Scale bar = 25 μm. B. Quantitative analysis of MDA-MB-231 cells showing colocalization of ErbB1-3 with ErbB2-4 (for details see legend to Figure 2). C. Quantitative analysis of cells showing ErbB1-3 and ErbB2-4 in distinct locations within the same cell. Data were analyzed as described in Figure 2.

Similar articles

Cited by

References

    1. Patel YC. Somatostatin and its receptor family. Frontiers in Neuroendocrinology. 1999;20:157–198. doi: 10.1006/frne.1999.0183. - DOI - PubMed
    1. Patel YC, Srikant CB. Somatostatin receptors. Trends Endocrinol Metab. 1997;8:398–405. doi: 10.1016/S1043-2760(97)00168-9. - DOI - PubMed
    1. Patel YC. Basic aspects of somatostatin receptors. In: LeRoith D, editor. Advances in Molecular and Cellular Endocrinology. Greenwich, CT , JAI Press; 1998.
    1. Ciocca DR, Puy LA, Fasoli LC, Tello O, Aznar JC, Gago FE, Papa SI, Sonego R. Corticotropin releasing hormone, leutinizing hormone releasing hormone, growth hormone releasing hormone, and somatostatin-like immunoreactivities in biopsies from breast cancer patients. Breast Cancer Res Treat. 1990;15:175–184. doi: 10.1007/BF01806354. - DOI - PubMed
    1. Nelson J, Cremin M, Murphy RF. Synthesis of somatostatin by breast cancer cells and their inhibition by exogenous somatostatin and sandostatin. Br J Cancer. 1989;59:739–742. - PMC - PubMed