

IsoSVM--distinguishing isoforms and paralogs on the protein level
- PMID: 16519805
- PMCID: PMC1431569
- DOI: 10.1186/1471-2105-7-110
IsoSVM--distinguishing isoforms and paralogs on the protein level
Abstract
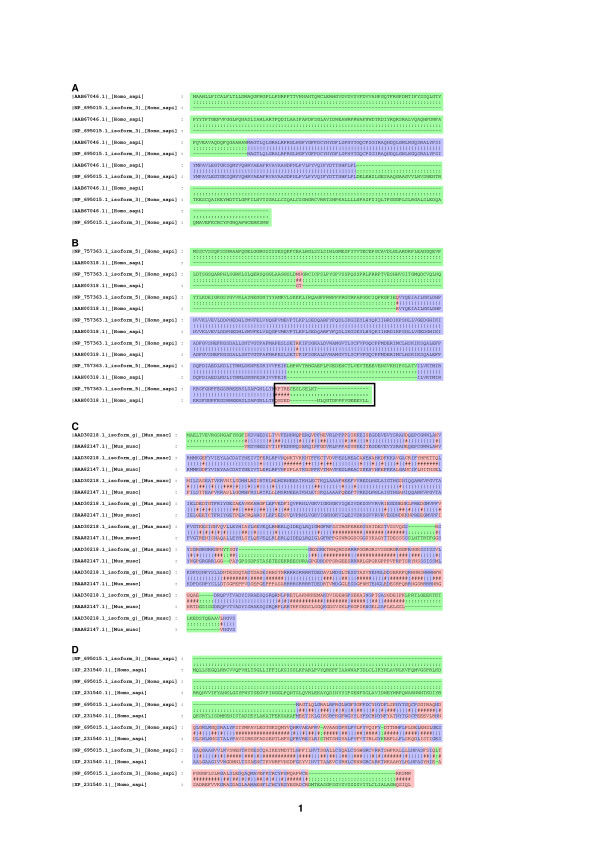
Background: Recent progress in cDNA and EST sequencing is yielding a deluge of sequence data. Like database search results and proteome databases, this data gives rise to inferred protein sequences without ready access to the underlying genomic data. Analysis of this information (e.g. for EST clustering or phylogenetic reconstruction from proteome data) is hampered because it is not known if two protein sequences are isoforms (splice variants) or not (i.e. paralogs/orthologs). However, even without knowing the intron/exon structure, visual analysis of the pattern of similarity across the alignment of the two protein sequences is usually helpful since paralogs and orthologs feature substitutions with respect to each other, as opposed to isoforms, which do not.
Results: The IsoSVM tool introduces an automated approach to identifying isoforms on the protein level using a support vector machine (SVM) classifier. Based on three specific features used as input of the SVM classifier, it is possible to automatically identify isoforms with little effort and with an accuracy of more than 97%. We show that the SVM is superior to a radial basis function network and to a linear classifier. As an example application we use IsoSVM to estimate that a set of Xenopus laevis EST clusters consists of approximately 81% cases where sequences are each other's paralogs and 19% cases where sequences are each other's isoforms. The number of isoforms and paralogs in this allotetraploid species is of interest in the study of evolution.
Conclusion: We developed an SVM classifier that can be used to distinguish isoforms from paralogs with high accuracy and without access to the genomic data. It can be used to analyze, for example, EST data and database search results. Our software is freely available on the Web, under the name IsoSVM.
Figures


Similar articles
-
SVM-Fold: a tool for discriminative multi-class protein fold and superfamily recognition.BMC Bioinformatics. 2007 May 22;8 Suppl 4(Suppl 4):S2. doi: 10.1186/1471-2105-8-S4-S2. BMC Bioinformatics. 2007. PMID: 17570145 Free PMC article.
-
SVM-HUSTLE--an iterative semi-supervised machine learning approach for pairwise protein remote homology detection.Bioinformatics. 2008 Mar 15;24(6):783-90. doi: 10.1093/bioinformatics/btn028. Epub 2008 Feb 1. Bioinformatics. 2008. PMID: 18245127
-
A new similarity measure among protein sequences.Proc IEEE Comput Soc Bioinform Conf. 2003;2:347-52. Proc IEEE Comput Soc Bioinform Conf. 2003. PMID: 16452810
-
PairProSVM: protein subcellular localization based on local pairwise profile alignment and SVM.IEEE/ACM Trans Comput Biol Bioinform. 2008 Jul-Sep;5(3):416-22. doi: 10.1109/TCBB.2007.70256. IEEE/ACM Trans Comput Biol Bioinform. 2008. PMID: 18670044
-
SCPRED: accurate prediction of protein structural class for sequences of twilight-zone similarity with predicting sequences.BMC Bioinformatics. 2008 May 1;9:226. doi: 10.1186/1471-2105-9-226. BMC Bioinformatics. 2008. PMID: 18452616 Free PMC article.
Cited by
-
Ancient dynamin segments capture early stages of host-mitochondrial integration.Proc Natl Acad Sci U S A. 2015 Mar 3;112(9):2800-5. doi: 10.1073/pnas.1407163112. Epub 2015 Feb 17. Proc Natl Acad Sci U S A. 2015. PMID: 25691734 Free PMC article.
-
Phylogenomic profiles of whole-genome duplications in Poaceae and landscape of differential duplicate retention and losses among major Poaceae lineages.Nat Commun. 2024 Apr 17;15(1):3305. doi: 10.1038/s41467-024-47428-9. Nat Commun. 2024. PMID: 38632270 Free PMC article.
-
PET/MRI Radiomics in Patients With Brain Metastases.Front Neurol. 2020 Feb 7;11:1. doi: 10.3389/fneur.2020.00001. eCollection 2020. Front Neurol. 2020. PMID: 32116995 Free PMC article. Review.
-
PIC-Me: paralogs and isoforms classifier based on machine-learning approaches.BMC Bioinformatics. 2021 Oct 21;22(Suppl 11):311. doi: 10.1186/s12859-021-04229-x. BMC Bioinformatics. 2021. PMID: 34674638 Free PMC article.
-
Revising transcriptome assemblies with phylogenetic information.PLoS One. 2021 Jan 12;16(1):e0244202. doi: 10.1371/journal.pone.0244202. eCollection 2021. PLoS One. 2021. PMID: 33434218 Free PMC article.
References
-
- Alberts B, Johnson A, Lewis J, Raff M, Roberts K, Walter P. Molecular Biology of the Cell. 4. Garland Publishing, New York; 2000.
-
- Graveley BR. Alternative splicing: increasing diversity in the proteomic world. Trends Genet. 2001;17:100–107. - PubMed
-
- Cartegni L, Chew SL, Krainer AR. Listening to silence and understanding nonsense: exonic mutations that affect splicing. Nature Reviews Genetics. 2002;3:285–298. - PubMed
-
- Grabowski PJ, Black DL. Alternative RNA splicing in the nervous system. Prog Neurobiol. 2001;65:289–308. - PubMed
-
- Fitch WM. Distinguishing homologous from analogous proteins. Syst Zool. 1970;19:99–113. - PubMed
Publication types
MeSH terms
Substances
LinkOut - more resources
Full Text Sources
Research Materials
