. 2006 Mar 6:7:109.
doi: 10.1186/1471-2105-7-109.

VANTED: a system for advanced data analysis and visualization in the context of biological networks

Affiliations

VANTED: a system for advanced data analysis and visualization in the context of biological networks

Björn H Junker et al. BMC Bioinformatics. .

Abstract

Background: Recent advances with high-throughput methods in life-science research have increased the need for automatized data analysis and visual exploration techniques. Sophisticated bioinformatics tools are essential to deduct biologically meaningful interpretations from the large amount of experimental data, and help to understand biological processes.

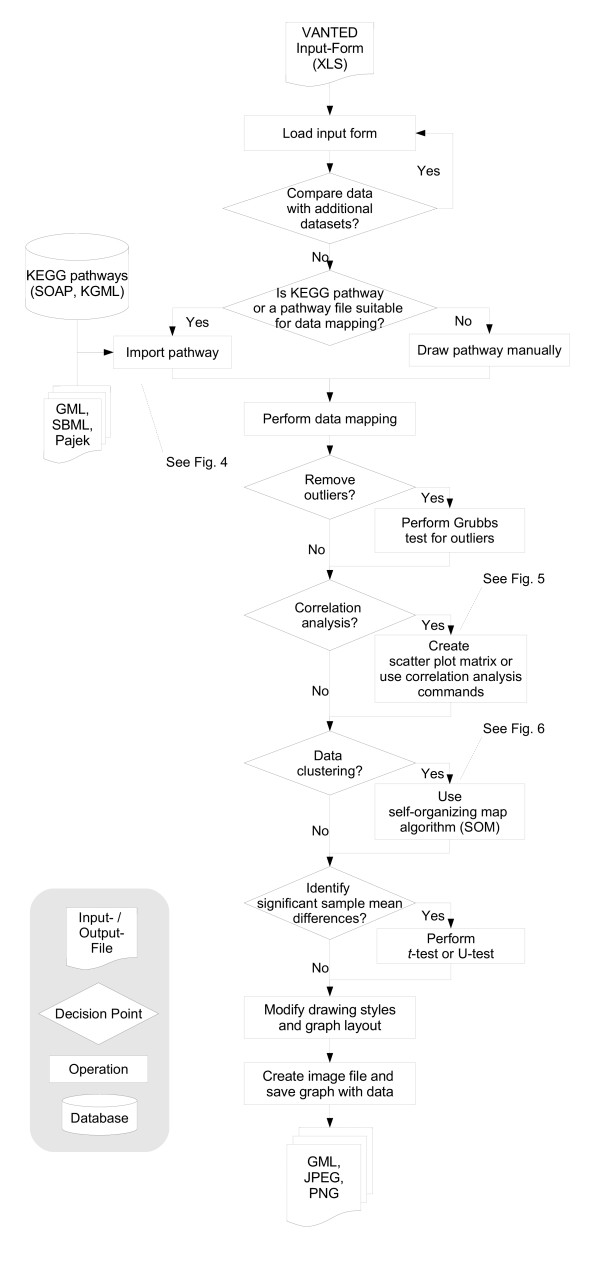
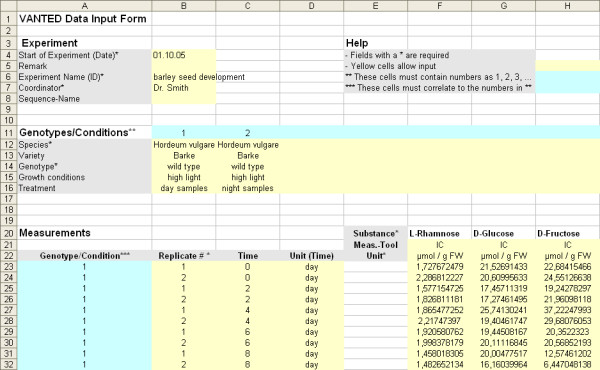
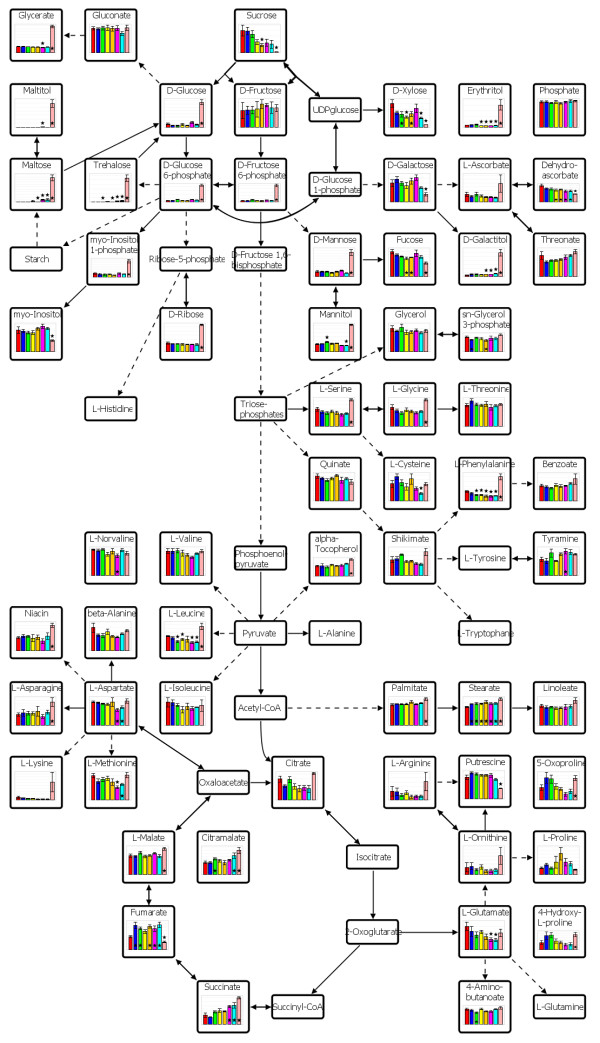
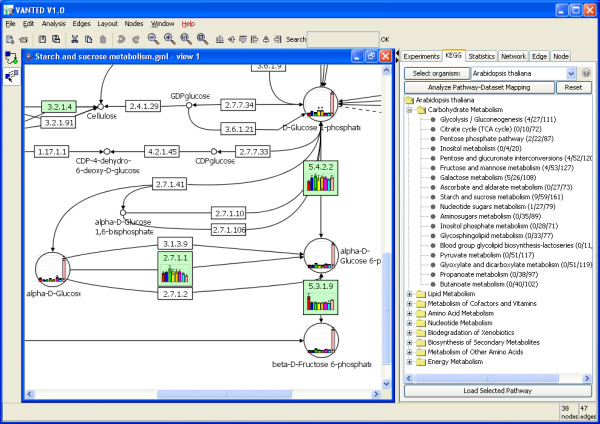
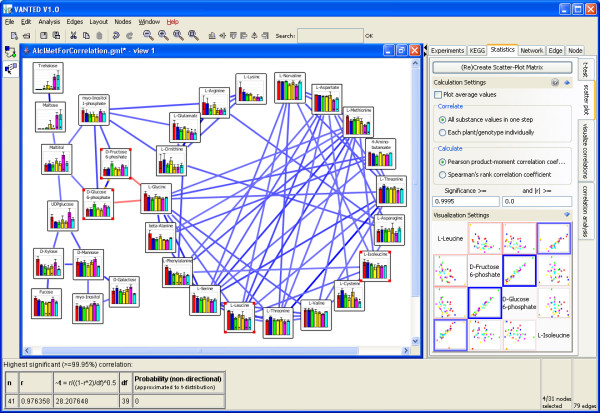
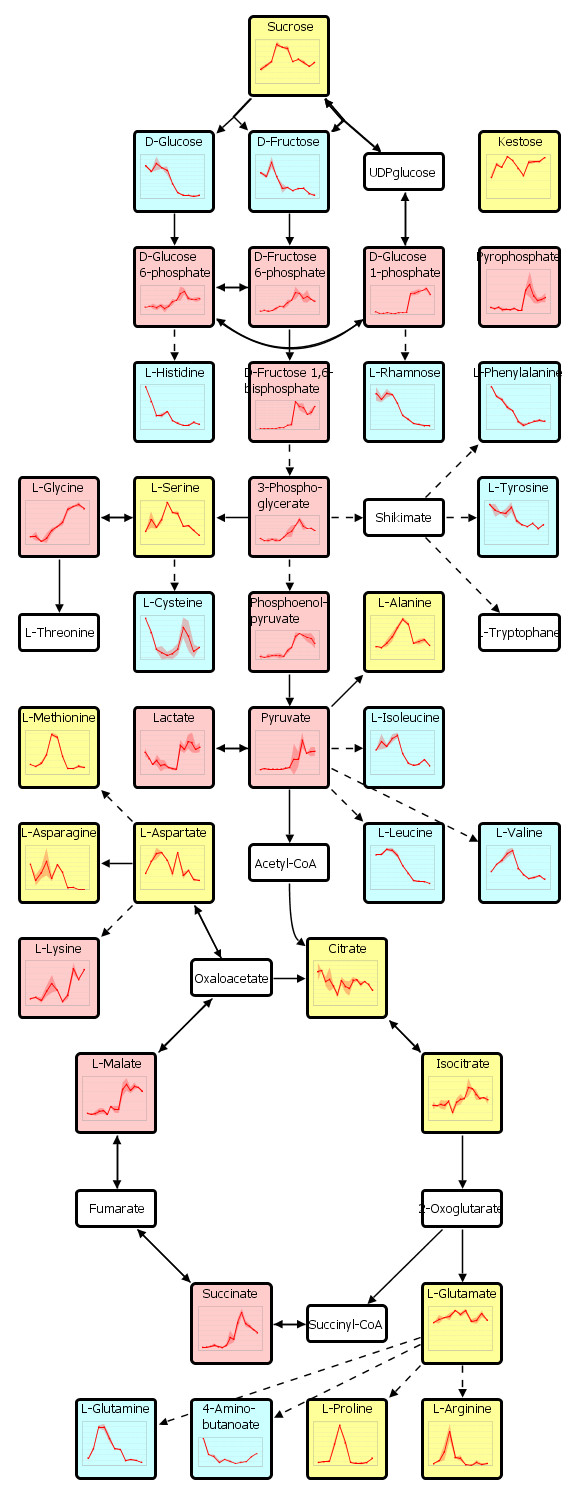
Results: We present VANTED, a tool for the visualization and analysis of networks with related experimental data. Data from large-scale biochemical experiments is uploaded into the software via a Microsoft Excel-based form. Then it can be mapped on a network that is either drawn with the tool itself, downloaded from the KEGG Pathway database, or imported using standard network exchange formats. Transcript, enzyme, and metabolite data can be presented in the context of their underlying networks, e. g. metabolic pathways or classification hierarchies. Visualization and navigation methods support the visual exploration of the data-enriched networks. Statistical methods allow analysis and comparison of multiple data sets such as different developmental stages or genetically different lines. Correlation networks can be automatically generated from the data and substances can be clustered according to similar behavior over time. As examples, metabolite profiling and enzyme activity data sets have been visualized in different metabolic maps, correlation networks have been generated and similar time patterns detected. Some relationships between different metabolites were discovered which are in close accordance with the literature.

Conclusion: VANTED greatly helps researchers in the analysis and interpretation of biochemical data, and thus is a useful tool for modern biological research. VANTED as a Java Web Start Application including a user guide and example data sets is available free of charge at http://vanted.ipk-gatersleben.de.


Figures

Figure 1
Figure 1
Work-flow of a typical session in VANTED. The pipeline for the visualization and analysis of biochemical data in the context of their underlying networks with VANTED. See Results section (Summary of VANTED's Features) for a detailed description.
Figure 2
Figure 2
Data input form. The VANTED template may be saved and modified with all applications that support the Microsoft Excel file format, e.g. MS-Office Excel, Open Office and Gnumeric. Information about the experiment, a description of the genotypes or sample conditions, and finally the data values including replicate number, sample time, measuring tool, and unit may be filled in. The template is then imported into VANTED for data visualization and analysis.
Figure 3
Figure 3
Metabolite data mapped on plant central metabolism. The metabolic network of the potato tuber was user-generated in VANTED. Metabolite profiling data of wildtype potato (Solanum tuberosum) tubers, and tubers expressing a yeast invertase either in an inducible or constitutive manner [33] was mapped onto the network. Each node represents a metabolite, connected by solid and dashed lines that represent single and lumped enzyme reactions, respectively. Data are means +/- standard error of the mean (SEM) of six independent plants. Values significantly different from the wildtype control as determined by an unpaired t-test (p < 005) were automatically marked with an asterisk. The bars in each diagram from left to right represent the values for the wildtype control (red), six inducible invertase lines, and one constitutive invertase line (light pink). The picture was created in VANTED and saved as a PNG file.
Figure 4
Figure 4
Mapping of enzyme and metabolite data on KEGG pathways. The pathway 500 (Starch and sucrose metabolism) was downloaded from the KEGG Pathway database [6]. Enzymes present in the model plant Arabidopsis thaliana as predicted from sequence information are shown in green. Selected enzyme activities and metabolite concentrations from wildtype potato tubers, and tubers expressing a yeast invertase either in an inducible or constitutive manner [33] were mapped on the pathway (which for better visualization was slightly modified using the built-in graph editor of VANTED). See legend of Figure 3 for details on the diagrams. The number of matches between the data set and all KEGG pathways is shown in the first number next to the pathway entry. The second number shows the number of enzymes in a pathway, the last the total number of nodes in the pathway (enzymes, metabolites, and links to other pathways).
Figure 5
Figure 5
Correlation graph and scatter plot generated from metabolite data. Selected metabolite data (amino acids, sugars and sugar derivates) from potato tubers expressing a yeast invertase in an inducible manner [33] were mapped onto nodes before a correlation analysis was performed. See legend of Figure 3 for details on the diagrams. Positive and negative correlations are visualized by blue and red edges, respectively. The intensity of the edge depends on the value of Pearson's product-moment correlation coefficient. A combination of circular and force-directed layout was performed for better visualization. On the side-panel, a scatter plot is shown for the four metabolites that are marked with the small red squares in the network. Samples are color coded depending on the plant line. In the status bar, information is displayed concerning the correlation edge that is marked with yellow squares in the network (between D-Fructose 6-phosphate and D-Glucose 6-phosphate).
Figure 6
Figure 6
Time series data clustered by self-organizing maps. Wildtype barley (Hordeum vulgare) caryopses were harvested every second day over a growth period of about 20 days post anthesis and analyzed for the dynamical changes of several central metabolites. The data set was mapped onto a network that was previously created in VANTED. Each node represents a metabolite, connected by solid and dashed lines that represent single and lumped enzyme reactions, respectively. Data are means of two independent plants, the standard error of the mean (SEM) is shown as a polygon around the line. A self-organizing map algorithm was performed to cluster the metabolites into three groups by similar behavior over time, which is visualized by the background color.

References

    1. Roessner U, Luedemann A, Brust D, Fiehn O, Linke T, Willmitzer L, Fernie AR. Metabolic profiling allows comprehensive phenotyping of genetically or environmentally modified plant systems. Plant Cell. 2001;13:11–29. doi: 10.1105/tpc.13.1.11. - DOI - PMC - PubMed
    1. Fiehn O, Kopka J, Dormann P, Altmann T, Trethewey RN, Willmitzer L. Metabolite profiling for plant functional genomics. Nature Biotechnology. 2000;18:1157–1161. doi: 10.1038/81137. - DOI - PubMed
    1. De Risi JL, Iyer VR, Brown PO. Exploring the metabolic and genetic control of gene expression on a genomic scale. Science. 1997;278:680–686. doi: 10.1126/science.278.5338.680. - DOI - PubMed
    1. Celis JE, Kruhoffer M, Gromova I, Frederiksen C, Ostergaard M, Thykjaer T, Gromov P, Yu JS, Palsdottir H, Magnusson N, Orntoft TF. Gene expression profiling: monitoring transcription and translation products using DNA microarrays and proteomics. FEBS Letters. 2000;480:2–16. doi: 10.1016/S0014-5793(00)01771-3. - DOI - PubMed
    1. Gibon Y, Blaesing OE, Hannemann J, Carillo P, Hohne M, Hendriks JHM, Palacios N, Cross J, Selbig J, Stitt M. A robot-based platform to measure multiple enzyme activities in Arabidopsis using a set of cycling assays: Comparison of changes of enzyme activities and transcript levels during diurnal cycles and in prolonged darkness. Plant Cell. 2004;16:3304–3325. doi: 10.1105/tpc.104.025973. - DOI - PMC - PubMed

Publication types

Substances