. 2006 Feb 14;12(6):915-20.
doi: 10.3748/wjg.v12.i6.915.

Epidural anaesthesia restores pancreatic microcirculation and decreases the severity of acute pancreatitis

Affiliations

Epidural anaesthesia restores pancreatic microcirculation and decreases the severity of acute pancreatitis

Alp Demirag et al. World J Gastroenterol. .

Abstract

Aim: To investigate the effect of epidural anaesthesia (EA) on pancreatic microcirculation during acute pancreatitis (AP).

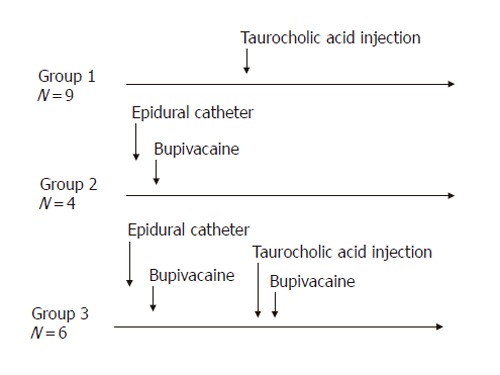
Methods: AP was induced by injection of sodium taurocholate into the pancreatic duct of Sprague-Dawley rats. To realize EA, a catheter was introduced into the epidural space between T7 and T9 and bupivacaine was injected. Microcirculatory flow was measured by laser Doppler flowmetry. Arterial blood gas analyses were performed. At the end of the experiment (<or=5 h), pancreas was removed for histology. The animals were divided into three groups: Group 1 (n=9), AP without EA; Group 2 (n=4), EA without AP; and Group 3 (n=6), AP treated by EA.

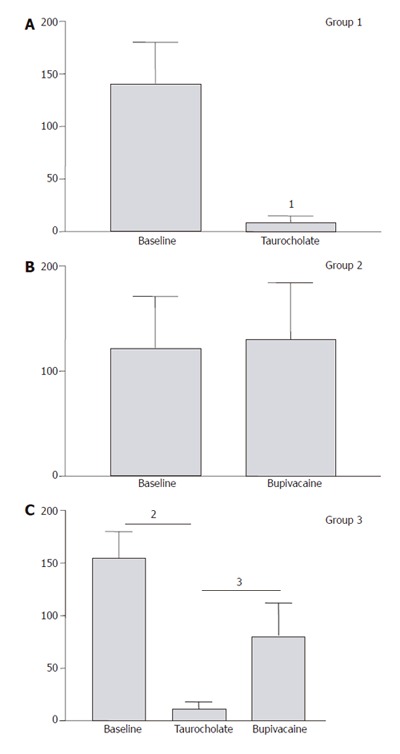
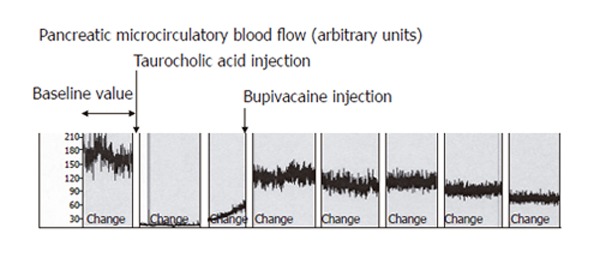
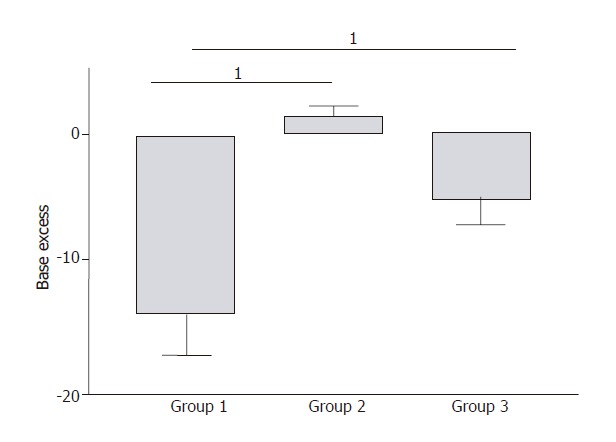
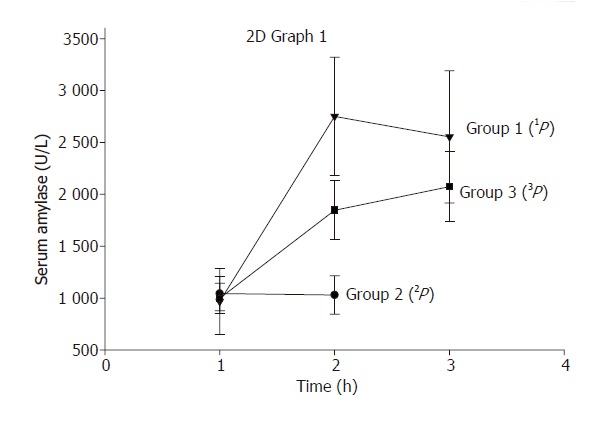
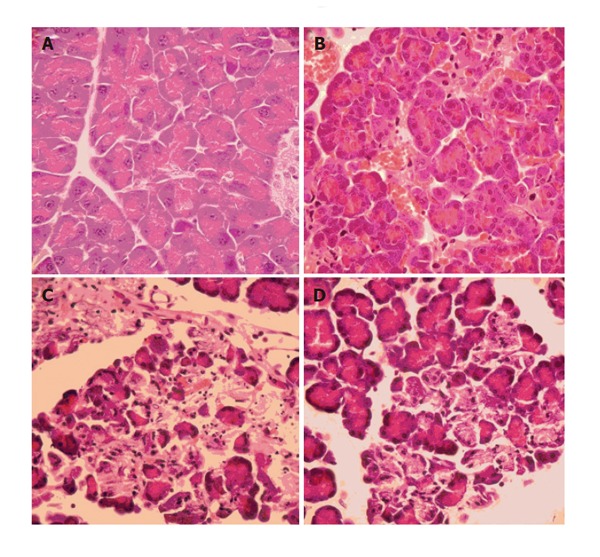
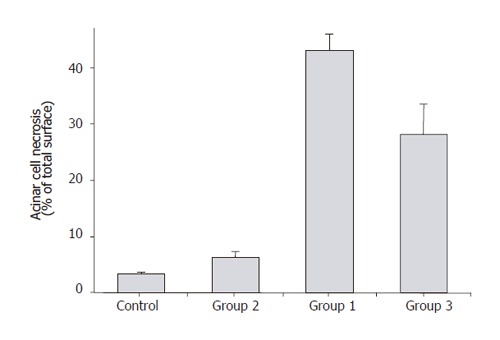
Results: In Group 1, pancreatic microcirculatory flow prior to AP was 141+/- 39 perfusion units (PU). After AP, microcirculatory flow obviously decreased to 9+/- 6 PU (P<0.05). Metabolic acidosis developed with base excess (BE) of -14+/-3 mmol/L. Histology revealed extensive edema and tissue necrosis. In Group 2, EA did not significantly modify microcirculatory flow. BE remained unchanged and histological analysis showed normal pancreatic tissue. In Group 3, AP initially caused a significant decrease in microcirculatory flow from 155+/-25 to 11+/-7 PU (P<0.05). After initiation of EA, microcirculatory flow obviously increased again to 81+/-31 PU (P<0.05). BE was -6+/-4 mmol/L, which was significantly different compared to Group 1 (P<0.05). Furthermore, histology revealed less extensive edema and necrosis in pancreatic tissue in Group 3 than that in Group 1.

Conclusion: AP caused dramatic microcirculatory changes within the pancreas, with development of metabolic acidosis and tissue necrosis. EA allowed partial restoration of microcirculatory flow and prevented development of tissue necrosis and systemic complications. Therefore, EA should be considered as therapeutic option to prevent evolution from edematous to necrotic AP.


Figures

Figure 1
Figure 1
Experimental design. Acute pancreatitis was induced in Groups 1 and 3 by injection of taurocholic acid (5%, 500 µL) into the biliopancreatic duct. Epidural anesthesia was induced in Groups 2 and 3 by epidural injection of bupivacaine
Figure 2
Figure 2
Pancreatic microcirculatory blood flow (arbitrary units). In Group 1, the mean value of pancreatic blood flow measured prior to and after induction of AP showed a significant decrease of perfusion from 141 ± 40 units to 9 ± 6 units (96%) (1P = 0.008) within 30 min. In Group 2, the mean value of pancreatic blood flow measured prior to and after induction of epidural anaesthesia showed no significant modification of perfusion. In Group 3, mean value of pancreatic blood flow measured prior to and after induction of AP, and epidural anaesthesia, respectively. Induction of AP caused a significant decrease in pancreatic microcirculatory flow from 155 ± 25 units to 11 ± 7 units (93%) (2P = 0.004). After induction of epidural anesthesia, mean pancreatic microcirculatory blood flow increased again significantly to 81 ± 31 units within 45 min, reaching 52% of base line values (3P = 0.028).
Figure 3
Figure 3
Recording of pancreatic microcirculatory blood flow in Group 3. Rats were injected with taurocholic acid and treated 30 min later with bupivacaine (0.4%, 20 µL) in the epidural catheter. Induction of AP caused a significant decrease in pancreatic microcirculatory blood flow. After induction of epidural anesthesia, mean pancreatic microcirculatory blood flow increased again significantly within 45 min, reaching approximately 50% of baseline values.
Figure 4
Figure 4
Arterial blood gas analyses. In Group 1, severe metabolic acidosis developed progressively reaching a maximum base excess (BE) value of -14 ± 3 mmol/L at the end of the experiment. In Group 2, BE values remained unchanged compared to baseline values. In Group 3, a mild metabolic acidosis developed reaching a maximum BE value of -6 ± 4 mmol/L at the end of the experiment. This result was significantly improved compared to Group 1 (1P = 0.007).
Figure 5
Figure 5
Serum amylase levels. In Group 1, serum amylase levels increased from 694 ± units/L 419 prior to AP to 2178 ± 561 units/L (1P < 0.05, vs serum amylase levels before induction of AP) after 2 h of induction of AP. In Group 2, epidural anaesthesia did not modify serum amylase levels significantly (P = 0.9). In Group 3, serum amylase levels increased to a maximum of 1829±641 units/L after 2 h of initiation of AP and epidural anesthesia. Although this result was lower compared to Group 1, but did not reach statistical significance (3P = 0.08).
Figure 6
Figure 6
Histopathological features of pancreatic tissue. A: A control animal was sacrificed and histopathology showed normal pancreas; B: Group 2 animals showing normal pancreatic tissue with minor modifications, possibly related to vasodilatation and surgical manipulations; C: Group 1 animals showing a severe form of AP with extensive edema and tissue necrosis; and D: Group 3 animals demonstrating less extensive pancreatic edema and necrosis compared to Group 1 animals.
Figure 7
Figure 7
Acinar cell necrosis (percentage of total pancreatic surface). The measure of acinar cell necrosis by percentage of total surface at high power field (HPF) showed that Group 2 animals had similar cell necrosis as the controls (<10%). Group 1 animals demonstrated over 40% acinar cell necrosis at HPF, whereas acinar cell necrosis was below 30% in Group 3 animals.

References

    1. Beger HG, Rau B, Isenmann R. Prevention of severe change in acute pancreatitis: prediction and prevention. J Hepatobiliary Pancreat Surg. 2001;8:140–147. - PubMed
    1. Bradley EL 3rd. A clinically based classification system for acute pancreatitis. Summary of the International Symposium on Acute Pancreatitis, Atlanta, Ga, September 11 through 13, 1992. Arch Surg. 1993;128:586–590. - PubMed
    1. Plusczyk T, Westermann S, Rathgeb D, Feifel G. Acute pancreatitis in rats: effects of sodium taurocholate, CCK-8, and Sec on pancreatic microcirculation. Am J Physiol. 1997;272:G310–G320. - PubMed
    1. Dobosz M, Hac S, Mionskowska L, Dobrowolski S, Wajda Z. Microcirculatory disturbances of the pancreas in cerulein-induced acute pancreatitis in rats with reference to L-arginine, heparin, and procaine treatment. Pharmacol Res. 1997;36:123–128. - PubMed
    1. Klar E, Schratt W, Foitzik T, Buhr H, Herfarth C, Messmer K. Impact of microcirculatory flow pattern changes on the development of acute edematous and necrotizing pancreatitis in rabbit pancreas. Dig Dis Sci. 1994;39:2639–2644. - PubMed