Comparative Study
. 2006 Apr;15(4):684-98.
doi: 10.1110/ps.051954706. Epub 2006 Mar 7.

NMR study of the tetrameric KcsA potassium channel in detergent micelles

Affiliations
Comparative Study

NMR study of the tetrameric KcsA potassium channel in detergent micelles

Jordan H Chill et al. Protein Sci. 2006 Apr.

Abstract

Nuclear magnetic resonance (NMR) studies of large membrane-associated proteins are limited by the difficulties in preparation of stable protein-detergent mixed micelles and by line broadening, which is typical of these macroassemblies. We have used the 68-kDa homotetrameric KcsA, a thermostable N-terminal deletion mutant of a bacterial potassium channel from Streptomyces lividans, as a model system for applying NMR methods to membrane proteins. Optimization of measurement conditions enabled us to perform the backbone assignment of KcsA in SDS micelles and establish its secondary structure, which was found to closely agree with the KcsA crystal structure. The C-terminal cytoplasmic domain, absent in the original structure, contains a 14-residue helix that could participate in tetramerization by forming an intersubunit four-helix bundle. A quantitative estimate of cross- relaxation between detergent and KcsA backbone amide protons, together with relaxation and light scattering data, suggests SDS-KcsA mixed micelles form an oblate spheroid with approximately 180 SDS molecules per channel. K(+) ions bind to the micelle-solubilized channel with a K(D) of 3 +/- 0.5 mM, resulting in chemical shift changes in the selectivity filter. Related pH-induced changes in chemical shift along the "outer" transmembrane helix and the cytoplasmic membrane interface hint at a possible structural explanation for the observed pH-gating of the potassium channel.


Figures

Figure 1
Figure 1
Biophysical characterization of KcsA. (A) Characterization of SDS-KcsA micelles by size-exclusion chromatography in conjunction with dynamic light scattering. The angle-dependent light scattering, proportional to protein concentration, is shown as a function of elution volume in blue. Molar mass values extracted from the analysis of light scattering and refractive index data for SDS–KcsA eluting between 10.7 and 11.5 mL are displayed in red. The estimated weight of the SDS–KcsA micelle is 115 ± 10 kDa. (B) CD spectra of 25 μM samples of tetrameric KcsA in various detergents. Almost identical curves for KcsA in SDS micelles at pH 6.0 and 8.0 are shown in black and blue, respectively. The highly similar curves obtained for KcsA in a 4:1 mix of DPC and SDS, and KcsA in DM are shown in red and green, respectively. Predicted helical contents are 47%, 51%, 57%, and 59% for SDS at pH 6, SDS at pH 8, 4:1 DPC:SDS and DM, respectively.
Figure 2
Figure 2
TROSY-HSQC fingerprint regions of the two KcsA domains. 1H-15N-TROSY-HSQC (tr-HSQC) fingerprint regions of the solvent-accessible domain, KcsAE (A), and the transmembrane domain, KcsATM (B). Spectra were acquired using 0.25–0.3 mM samples of tetrameric KcsA samples in 25 mM MES (pH 6.0) and SDS at 400–600:1 excess on a Bruker DRX800 spectrometer equipped with a cryogenic triple-resonance probe. Total acquisition time was 60 (90) min for the KcsAE (KcsATM) domain.
Figure 3
Figure 3
Backbone assignment of KcsATM using inter-residual 1HN-1HN connectivities. Strips derived from a 15N-separated NOEHMQC spectrum of KcsATM exhibit the characteristic helical 1HN-1HN NOE pattern that facilitated backbone assignment of this domain. Each strip represents a single KcsATM amide proton, with 1H and 15N chemical shift resonances shown below the strips. Off-diagonal cross-peaks indicate the resonance frequency of the two adjacent amide protons (dotted boxes), indicating the identity of the neighboring residues. This “backbone walk” is demonstrated for residues 96–103 in the TM2 helix. The spectrum was acquired on a Bruker DRX800 spectrometer equipped with a cryogenic triple-resonance probe for a sample of 0.25 mM tetrameric KcsATM in 25 mM MES (pH 6.0), 600:1 excess SDS, and 99% D2O, using a mixing time of 70 msec.
Figure 4
Figure 4
Assignment of KcsA resonances. Shown is the sequence of KcsA16–160 used in the current study. Shaded gray residues have amide protons that are inexchangeable or very slowly exchangeable in D2O, and represent the KcsATM domain. Other residues are solvent accessible and comprise the KcsAE domain. Residues in open gray rectangles are observed in both samples. Overhead gray bars indicate the two membrane-spanning helices and the pore helix as seen in the crystal structure (Doyle et al. 1998). The selectivity filter (residues 75–79) is heavily underlined, and residues 114–118, exhibiting a large pH-induced change in chemical shift, are lightly underlined. The N-terminal His6-tag used for purification is omitted for clarity.
Figure 5
Figure 5
Backbone NMR data predict the secondary structure of KcsA. Deviations of chemical shifts from random coil values (based on Zhang et al. 2003) are shown for 13Cα (A) and 13C′ (B) nuclei along the KcsA backbone. Downfield values (positive deviations) of the 13C resonance indicate a backbone helical conformation. (C) 1HN(i)-1HN(i+1) NOE connectivities observed in 15N-separated NOE-HMQC spectra of KcsA. Data from several spectra were combined by measuring ratios between cross-peak and diagonal peak intensities, and classifying these in two categories, corresponding to strong and weak 1HN(i)-1HN(i + 1) interactions. (D) HX rates of KcsA amide protons. Exchange rates were measured by comparing the intensity of a given tr-HNCO peak acquired at 600 MHz with and without a preceding water-inversion peak. KcsATM protons are considered nonexchangeable on this scale, as designated by the open squares along the axis. No effort was made to exclude the effect of exchangeable-proton-mediated magnetization transfer, which may increase apparent exchange rates. For example, the elevated rate observed for T112 is likely the result of fast exchange of its β-OH proton with solvent, followed by NOE magnetization transfer to its backbone amide. The secondary structure elements in the crystal structure (Doyle et al. 1998) and as determined by NMR are shown above in filled and open circles, respectively.
Figure 6
Figure 6
Amide proton attenuation due to intermolecular detergent–protein NOEs. Shown is the ratio of the intensity of a given tr-HNCO correlation in the presence and absence of a selective inversion pulse applied to SDS protons followed by a mixing time of 250 msec. The figure displays attenuations upon inverting the C2H2 methylene group, resonating at 1.5 ppm (A), the nine overlapping methylene groups, C3–11H2, resonating at 1.25 ppm (B), and the terminal methyl group, C12H3, resonating at 0.85 ppm (C). Due to the effective magnetization transfer by intraprotein NOE and in the interests of improved signal-to-noise, a smoothing function was applied to the three curves where each data point represents a weighted average of a triad of amide protons, with all data weighted by the inverse of the experimental error squared, and the center proton doubly weighted with respect to its neighbors. tr-HNCO data were acquired separately for KcsAE and KcsATM at 600 MHz, with total experimental times of 14 and 60 h, respectively. The secondary structure elements in the crystal structure (Doyle et al. 1998) and as determined by NMR are shown above in filled and open circles, respectively.
Figure 7
Figure 7
Structural representation of detergent-protein NOE magnetization transfer. The results of the intermolecular NOE experiments for inversion of C2H2 protons (A), C3–11H2 protons (B), and C12H3 protons (C) are mapped upon the crystal structure of residues 23–119 of KcsA (Doyle et al. 1998). Only two diametrically opposed subunits of the tetramer are shown for clarity. Residues colored red to green represent a gradual scale of weakening intermolecular interactions.
Figure 8
Figure 8
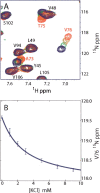
K+-titration of the KcsA channel in SDS micelles. (A) Region of the 1H-15N-tr-HSQC spectrum of tetrameric KcsA in 200 mM SDS and 25 mM MES (pH 6.0) in 99% D2O acquired on a DRX800 spectrometer at 323 K. Spectra at 0, 1, 3, and 7 mM KCl are shown in blue, green, yellow, and red, respectively. Residues A73, T75, and V76 of the selectivity filter and its environment (red labels) exhibit chemical shift changes, while other residues (black labels) are unaffected by the change in K+ concentration. (B) Titration curve following the chemical shift of the V76 backbone 15N, which exhibits the largest K+-induced change. The best fitted curve assuming (to a first-order approximation) a bimolecular reaction between tetrameric channel and K+ ion corresponds to a KD of 3 ± 0.5 mM.
Figure 9
Figure 9
pH-induced changes in KcsA backbone chemical shifts. Chemical shifts of the 1H-15N backbone moiety at pH 6.0 and 8.0 are compared. The y-axis represents a weighted change in chemical shift Δ, defined as Δ=sqrt[(δH)2 +(δN/5)2], with δH and δN representing the changes in chemical shift of amide 1H and 15N, respectively, between the two pH values. Experimental uncertainty in Δ is ≤0.01 ppm. Overhead triangular markers designate residues with pH-dependent electrostatic characteristics that may exert a local effect upon chemical shift. Dark triangles represent His residues (excluding the first five residues of the His6 tag), and open triangles represent the acidic residues Asp and Glu. While the pKa of the acidic residues is below five, this value may be elevated by the negatively charged headgroups of SDS, a possibility supported by the correlation between chemical shift change in the C-terminal domain and the location of these residues. Of the residues lacking a His/Asp/Glu neighbor, residues F114 and V115 represent the largest observed chemical shift change.
Figure 10
Figure 10
Assembly of the KcsA-containing SDS micelle as suggested by cross-relaxation attenuation maps. Shown is a cross-section through the KcsA-containing SDS micelle defined by the pore helices of two diametrically opposed KcsA subunits. The TM1 (residues 27–51), TM2 (residues 86–112), and pore helices (residues 62–74, numbers not shown) of the emphasized subunits are shown in light blue, purple, and pink, respectively. The distant subunit is shown in gray, and the front subunit is omitted for clarity. SDS molecules (drawn to scale) are black, with the anionic head groups represented by large open circles, and the C2 and C12 carbons highlighted as filled squares and circles, respectively. Attenuation originating from inversion of C12 protons is most significant for KcsA residues at the center of the TM1 and TM2 helices, and the C-terminal end of the pore helix. Attenuation originating from inversion of C2 protons is most pronounced for residues of the pore helix and for residues at both ends of the TM helices.

References

    1. Arora A. and Tamm L.K. 2001. Biophysical approaches to membrane protein structure determination Curr. Opin. Struct. Biol. 11: 540–547. - PubMed
    1. Arora A., Abildgaard F., Bushweller J.H., Tamm L.K. 2001. Structure of outer membrane protein A transmembrane domain by NMR spectroscopy Nat. Struct. Biol. 8: 334–338. - PubMed
    1. Bax A. and Grzesiek S. 1993. Methodological advances in protein NMR Acc. Chem. Res. 26: 131–138.
    1. Cai M., Huang Y., Sakaguchi K., Clore G.M., Gronenborn A.M., Craigie R. 1998. An efficient and cost-effective isotope labeling protocol for proteins expressed in Escherichia coli J. Biomol. NMR 11: 97–102. - PubMed
    1. Chamberlain A.K. and Bowie J.U. 2004. Analysis of side-chain rotamers in transmembrane proteins Biophys. J. 87: 3460–3469. - PMC - PubMed

Publication types

MeSH terms