Comparative Study
. 2006 Mar 8;26(10):2673-83.
doi: 10.1523/JNEUROSCI.4689-05.2006.

NMDA receptors mediate neuron-to-glia signaling in mouse cortical astrocytes

Affiliations
Comparative Study

NMDA receptors mediate neuron-to-glia signaling in mouse cortical astrocytes

Ulyana Lalo et al. J Neurosci. .

Abstract

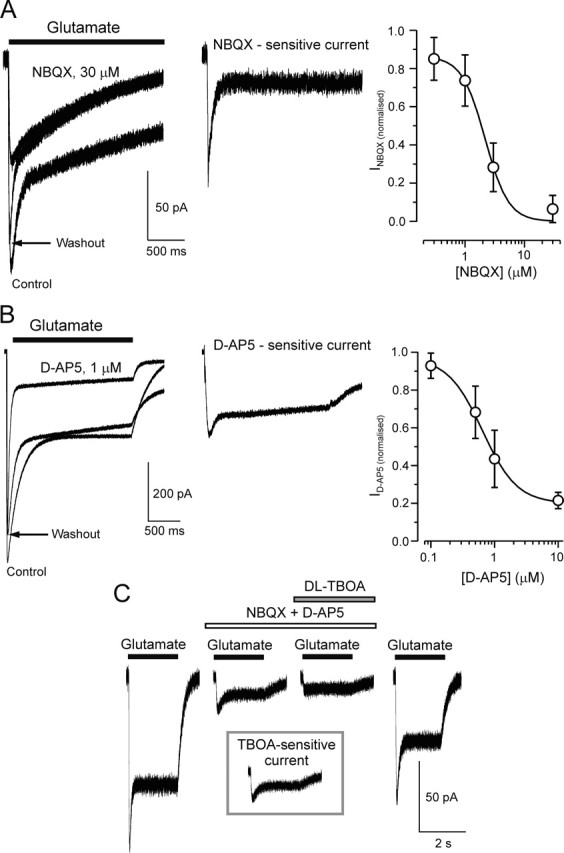
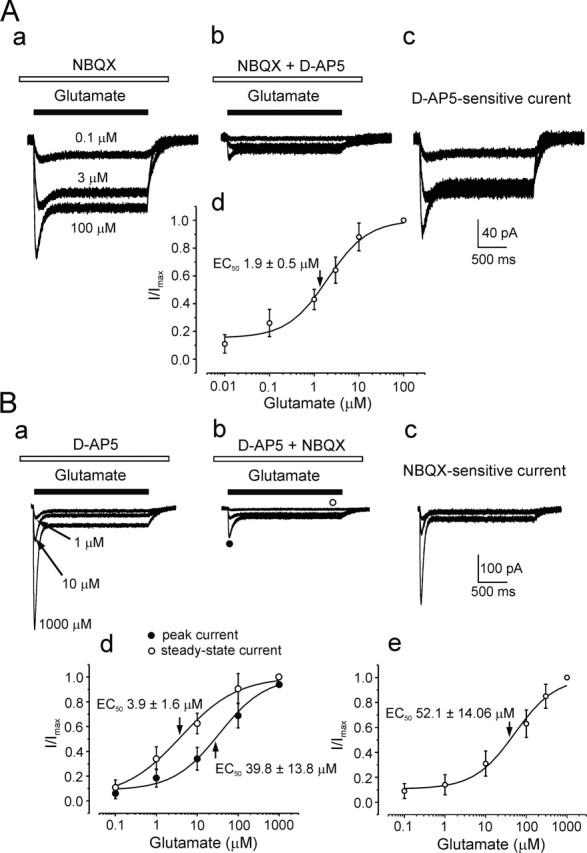
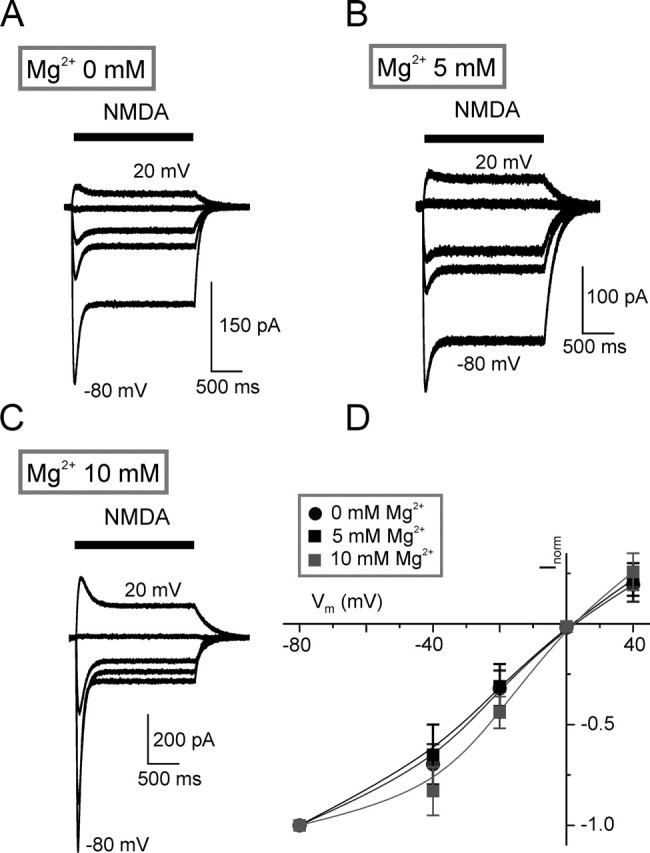
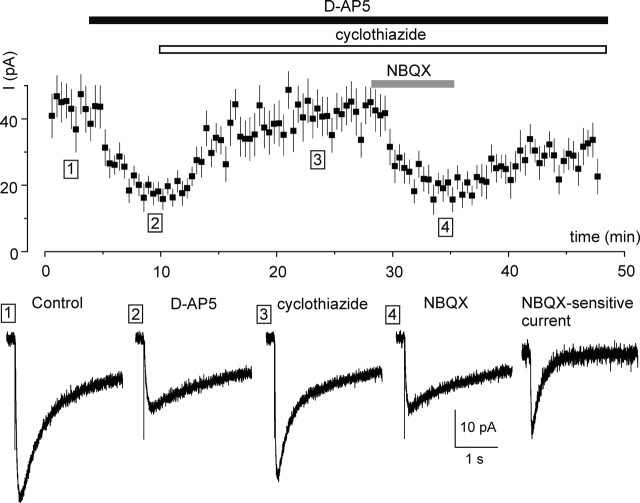
Chemical transmission between neurons and glial cells is an important element of integration in the CNS. Here, we describe currents activated by NMDA in cortical astrocytes, identified in transgenic mice that express enhanced green fluorescent protein under control of the human glial fibrillary acidic protein promoter. Astrocytes were studied by whole-cell voltage clamp either in slices or after gentle nonenzymatic mechanical dissociation. Acutely isolated astrocytes showed a three-component response to glutamate. The initial rapid component was blocked by 1,2,3,4-tetrahydro-6-nitro-2,3-dioxo-benzo[f]quinoxaline-7-sulfonamide (NBQX), which is an antagonist of AMPA receptors (IC50, 2 microM), and the NMDA receptor antagonist D-AP-5 blocked the later sustained component (IC50, 0.6 microM). The third component of glutamate application response was sensitive to D,L-threo-beta-benzyloxyaspartate, a glutamate transporter blocker. Fast application of NMDA evoked concentration-dependent inward currents (EC50, 0.3 microM); these showed use-dependent block by (+)-5-methyl-10,11-dihydro-5H-dibenzo [a,d] cyclohepten-5,10-imine maleate (MK-801). These NMDA-evoked currents were linearly dependent on membrane potential and were not affected by extracellular magnesium at concentrations up to 10 mM. Electrical stimulation of axons in layer IV-VI induced a complex inward current in astrocytes situated in the cortical layer II, part of which was sensitive to MK-801 at holding potential -80 mV and was not affected by the AMPA glutamate receptor antagonist NBQX. The fast miniature spontaneous currents were observed in cortical astrocytes in slices as well. These currents exhibited both AMPA and NMDA receptor-mediated components. We conclude that cortical astrocytes express functional NMDA receptors that are devoid of Mg2+ block, and these receptors are involved in neuronal-glial signal transmission.


Figures

Figure 1.
Figure 1.
Identification of astrocytes after mechanical isolation and the effect of glutamate on an individual astroglial cell. A, Epifluorescence image of an isolated astrocyte. B, Representative currents recorded from the astrocyte shown in A in response to hyperpolarizing and depolarizing steps from −120 to +40 mV (step interval, 20 mV), from the holding potential of −80 mV. C, Current–voltage relationship from isolated cortical astrocytes. Amplitudes of currents were normalized to the value measured at 0 mV (Inorm); points are mean ± SD for 20 cells. D, Voltage dependence of the current evoked by glutamate in an isolated astrocyte. The left panel shows currents induced by rapid application of glutamate (10 μm, 2 s) recorded at the different holding potentials as indicated. The right panel shows an I–V curve constructed from 11 independent experiments. The amplitudes of currents were normalized to the value measured at −40 mV (Inorm).
Figure 2.
Figure 2.
Selective AMPA and NMDA antagonists differentially suppress glutamate-induced current in single astrocytes. A, NBQX inhibits the fast component of glutamate-induced current. Representative traces illustrate the current before, during, and after application of 30 μm NBQX (left) and the NBQX-sensitive current obtained by subtraction (middle). The right panel shows the concentration dependence of the block of the fast component for four cells (IC50, 2.2 ± 0.4 μm; Hill coefficient, 1.9). B, d-AP-5 inhibits the slow component of glutamate-induced current. Representative traces demonstrating the effect of 1 μm d-AP-5 (left) and the d-AP-5-sensitive component obtained by subtraction (middle) are shown. The right panel shows the concentration dependence of the block for five cells (IC50, 0.64 ± 0.1 μm; Hill coefficient, 1.6). Error bars represent SD. C, NBQX (30 μm) and d-AP-5 (10 μm) applied together inhibit both the fast and slow current components. The residual current is sensitive to glutamate transporter blocker dl-TBOA (100 μm). The inset shows the trace of dl-TBOA-sensitive component of residual current obtained by digital subtraction.
Figure 3.
Figure 3.
Concentration dependences of glutamate receptor-mediated and glutamate transporter-mediated currents in cortical astrocytes. Aa–Ac, Protocol of pharmacological isolation of NMDA receptor-mediated current. Responses to 2-s-long application of different concentrations of glutamate were recorded in the presence of 30 μm NBQX (Aa) and in the presence of NBQX and 30 μm d-AP-5 (Ab). Ac, The net NMDA receptor-mediated current component obtained by subtracting the residual current (recorded under NBQX and d-AP-5) from current recorded under NBQX. Ad, Glutamate concentration dependence for d-AP-5-sensitive current (EC50, 1.9 ± 0.5 μm; Hill coefficient, 1.5) averaged for nine cells. Ba–Bc, Isolation of AMPA receptor-mediated current in response to glutamate using protocol similar to that described for A. Bd, Concentration dependence for peak and steady-state components of residual glutamate transporter-mediated current averaged for 17 cells; glutamate EC50 values were 39.8 ± 13.8 and 3.9 ± 1.6 μm for peak and steady-state currents, respectively. Be, Concentration dependence for AMPA receptor-mediated component of glutamate-evoked current (EC50, 52 ± 14 μm; Hill coefficient, 1.4) obtained from eight cells. All recordings were made at a holding potential of −80 mV. Error bars represent SD.
Figure 4.
Figure 4.
Comparison of NMDA-induced currents recorded from an astrocyte and a neuron isolated from the same slice. A, NMDA-induced (2 s application) currents in a single astrocyte (left) and concentration–response curve constructed from six such experiments (middle; EC50, 0.34 ± 0.06 μm; Hill coefficient, 1.5). The right panel shows the neuron (N) and astrocyte (A) from which the recordings were made in C and D. B, Glycine-dependent potentiation of astrocyte NMDA response. NMDA-induced currents in glycine-free normal extracellular solution are shown on the left; NMDA-induced currents in the presence of different glycine concentrations (30 nm, 1 μm, 10 μm, and 30 μm) are displayed in the middle. The concentration–response curve (ΔInorm represents the amplitudes of current increase normalized to the maximal increase at 30 μm glycine) constructed from seven experiments is shown on the right (EC50, 1.1 ± 0.07 μm; Hill coefficient, 1.2). C, Recordings from the astrocyte. The left panel shows currents in response to short voltage pulses. The middle panel shows currents recorded at different holding potentials (−80 to 40 mV; 20 mV increment) in response to NMDA (10 μm). The right panel shows the current–voltage curve constructed from eight independent experiments (currents normalized to the value at −40 mV). C, Recordings from the neuron. The left panel shows currents in response to short voltage pulses; depolarization induces inward and outward current characteristic of neurons. The middle panel shows the currents evoked by 10 μm NMDA (holding potentials from −80 to 40 mV; 20 mV increment). The right panel shows the current–voltage curve from four separate experiments (currents were normalized to the value measured at −40 mV). Note the typical region of negative slope conductance between −80 and −40 mV. Extracellular Mg2+ concentration was 1 mm throughout. Error bars represent SD.
Figure 5.
Figure 5.
NMDA-induced current in astrocytes are unaffected by magnesium. A–C, Currents evoked by NMDA (10 μm) at holding potentials of −80, −40, −20, 0, and 20 mV in the presence of a different concentration of magnesium in external solution. D, Current–voltage plots for NMDA-induced currents for different Mg2+ concentrations (0 mm, n = 3; 5 mm, n = 4; and 10 mm, n = 4). The amplitudes of currents were normalized to the value measured at −80 mV. Note that NMDA-induced currents in astrocytes are weakly affected only by high (10 mm) concentration of magnesium. Error bars represent SD.
Figure 6.
Figure 6.
Pharmacological properties of NMDA-induced currents in astrocytes. A, Left, Currents evoked by NMDA before, during, and after application of MK-801 (10 μm). In MK-801, repeated applications of NMDA resulted in a use-dependent inhibition of the current. The current recovered after several additional NMDA applications at a positive holding potential. The holding potential protocol is shown above the current traces. The right panel shows the pooled results from several similar experiments. The amplitude of the NMDA-induced current is normalized to that before MK-801. Points represent mean ± SD for five to eight cells. The gradual decline of current is indicative of a use-dependent block. B, NMDA-induced currents in control conditions and in the presence of ifenprodil (10 μm). Note that the currents were inhibited by ifenprodil in four cells (right), whereas in the other nine cells, it failed to affect the NMDA responses.
Figure 7.
Figure 7.
Synaptic currents mediated by NMDA receptors in astrocytes. Astrocytes in layer II of the slice were identified by EGFP fluorescence; electrical stimulation was in layer IV. A, Synaptically evoked currents are inhibited by MK-801 (10 μm), and the residual current is partially blocked by dl-TBOA (100 μm). The dl-TBOA-sensitive component obtained by subtraction is shown in the inset. B, In the presence of dl-TBOA (100 μm), NBQX (30 μm) has no effect on the peak synaptic current, which is then almost completely blocked by MK-801 (10 μm). Each point on the time graphs represents the mean ± SEM for five EPSCs; illustrative EPSCs are shown below. Note that the tail current was mostly blocked by dl-TBOA, whereas the initial peak current was unaffected by NBQX but blocked by MK-801. C, Current–voltage relationship for a typical astrocyte (voltage steps of 20 mV from −100 to +60 mV; holding potential, −80 mV). Amplitudes were normalized to the value measured at 0 mV (Inorm). Each point represents the mean ± SD for seven cells. D, Selective inhibition of peak and tail current by MK-801 and dl-TBOA. MK-801 (10 μm) and dl-TBOA (100 μm) were applied separately to different astrocytes as illustrated in A and B. The peak (Ipeak) and tail (Itail) of the current were averaged within the 20 ms time window as indicated in the bottom panel of B; error bars are mean ± SEM. The amplitudes were normalized to the values of Ipeak, Itail, and IpeakItail before drug application. E, Voltage dependence of synaptic currents in astrocytes. Note the reversal close to 0 mV and the almost linear relationship between current and voltage. Currents were recorded in the presence of NBQX (30 mm) and dl-TBOA (100 mm). Im, Amplitude of membrane current.
Figure 8.
Figure 8.
Inhibition of AMPA receptor desensitization reveals the NBQX-sensitive synaptic current component that appears in astrocytes. Top, Time course of synaptic current recorded in an astrocyte identified in neocortical layer II by GFEP fluorescence. Each point represents the mean ± SEM for five EPSCs. Bottom, Illustrative currents recorded in control and after consecutive application of d-AP-5 (30 μm), cyclothiazide (50 μm), and NBQX (30 μm). The NBQX-sensitive current was obtained by digital subtraction of currents recorded before and after application of NBQX. The NBQX-sensitive current had a rise time of 16 ± 8 ms and decay time of 280 ± 90 ms (n = 6).
Figure 9.
Figure 9.
Miniature spontaneous excitatory currents in cortical astrocytes are mediated by AMPA and NMDA glutamate receptors. A, Representative whole-cell recordings in control and after application of NBQX (30 mm). The right panels represent generalized waveform of spontaneous currents (average of 50 events). The bottom graph shows probability density function of spontaneous currents in control (solid line) and in the presence of NBQX (dots). B, Representative whole-cell recordings from astrocytes in cortical slice in control and after application of d-AP-5 (30 μm). The right panel shows a generalized waveform of spontaneous currents (average of 50 events). The bottom graph shows probability density function of spontaneous currents in control (solid line) and in the presence of d-AP-5 (dots). All recordings were made at a holding potential of −80 mV in the presence of TTX (1 μm), picrotoxin (100 μm), and dl-TBOA (100 μm). Note the significant decrease in the amplitude of spontaneous current as well as leftward shift of amplitude distributions under action of glutamate receptor antagonists.

Similar articles

Cited by

References

    1. Akaike N, Moorhouse AJ (2003). Techniques: applications of the nerve-bouton preparation in neuropharmacology. Trends Pharmacol Sci 24:44–47. - PubMed
    1. Akopian G, Kuprijanova E, Kressin K, Steinhuser C (1997). Analysis of ion channel expression by astrocytes in red nucleus brain stem slices of the rat. Glia 19:234–246. - PubMed
    1. Alvarez-Maubecin V, Garcia-Hernandez F, Williams JT, Van Bockstaele EJ (2000). Functional coupling between neurons and glia. J Neurosci 20:4091–4098. - PMC - PubMed
    1. Araque A, Carmignoto G, Haydon PG (2001). Dynamic signaling between astrocytes and neurons. Annu Rev Physiol 63:795–813. - PubMed
    1. Bergles DE, Tzingounis AV, Jahr CE (2002). Comparison of coupled and uncoupled currents during glutamate uptake by GLT-1 transporters. J Neurosci 22:10153–10162. - PMC - PubMed

Publication types

MeSH terms

LinkOut - more resources