Comparative Study
. 2006 Mar 8;26(10):2745-56.
doi: 10.1523/JNEUROSCI.5238-05.2006.

Prefrontal cell activities related to monkeys' success and failure in adapting to rule changes in a Wisconsin Card Sorting Test analog

Affiliations
Comparative Study

Prefrontal cell activities related to monkeys' success and failure in adapting to rule changes in a Wisconsin Card Sorting Test analog

Farshad A Mansouri et al. J Neurosci. .

Abstract

The cognitive flexibility to select appropriate rules in a changing environment is essential for survival and is assumed to depend on the integrity of prefrontal cortex (PFC). To explore the contribution of the dorsolateral PFC to flexible rule-based behavior, we recorded the activity of cells in this region of monkeys performing a Wisconsin Card Sorting Test (WCST) analog. The monkey had to match a sample to one of three test items by either color or shape. Liquid reward and a discrete visual signal (error signal) were given as feedback to correct and incorrect target selections, respectively. The relevant rule and its frequent changes were not cued, and the monkeys could find it only by interpreting the feedback. In one-third of cells, cellular activity was modulated by the relevant rule, both throughout the trial and between trials. The magnitude of the modulation correlated with the number of errors that the monkeys committed after each rule change in the course of reestablishing high performance. Activity of other cells differed between correct and error trials independently from the rule-related modulation. This difference appeared during actual responses and before the monkeys faced the problems. Many PFC cells responded to the error-signal presentation, and, in some of them, the magnitude of response depended on the relevant rule. These results suggest that the dorsolateral PFC contributes to WCST performance by maintaining the relevant rule across trials, assessing behavioral outcomes, and monitoring the processes that could lead to success and failure in individual trials.


Figures
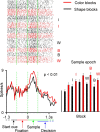
Figure 1.
Figure 1.
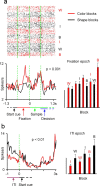
Activity difference between color and shape blocks during the sample epoch in a PFC cell. The raster gram indicates activities of a PFC cell in individual correct trials, aligned at the onset of sample presentation, in color and shape blocks. Each row corresponds to a trial, and each dot represents an action potential. The line graphs at the bottom left show the averaged firing rates in color and shape blocks, also aligned at the sample onset. The bin size is 50 ms. The p value indicates the significance level of interaction between rule and epoch in a two-way ANOVA. The bar graph at the bottom right represents the mean firing rate during the sample epoch in consecutive blocks. Vertical calibration bar, 5 spikes/s. The error bars of the bar graph represent SEMs. Red and black colors of dots, lines, and bars indicate color and shape blocks, respectively. The best-, intermediate-, and worst-performance blocks are marked by B, I, and W, respectively.
Figure 2.
Figure 2.
Two other PFC cells with significant activity differences between color and shape blocks during the fixation and ITI epochs. The notation is the same as that in Figure 1, except that, for the cell in b, the activities were aligned at the start-cue onset. The rule dependence appeared in the fixation epoch and ITI epoch for the cells in a and b, respectively. There is no raster gram shown for the cell in b.
Figure 3.
Figure 3.
The distribution of activity differences between color and shape blocks in different trial epochs. Each line corresponds to one cell. The solid parts of the line indicate the epochs in which the cell showed significant differences between color and shape blocks. The thin broken parts connect the epochs with significant differences when significant differences appeared in discontinued epochs. Of the 71 cells for which the ANOVA showed significant rule dependency, two cells are not shown here because they did not show significant differences when the activity difference was examined by t test for each epoch. For 16 of the 71 cells, which were recorded at an early stage of the experiment, we did not store the activity during the ITI.
Figure 4.
Figure 4.
Correlation of the magnitude of activity differences between color and shape blocks with monkeys' performance. ac, The averaged activity differences between pairs of the best-, intermediate-, and worst-performance blocks, for the cells shown in Figures 1, 2a, and 2b, respectively. d, The mean normalized activity differences between pairs of the best-, intermediate-, and worst-performance blocks, for the population of 69 cells. The differences were normalized by the mean activity of individual cells and then averaged over the 69 cells. The averaging across cells was made for preferred and nonpreferred rules. e, The difference in activity (preferred − nonpreferred) between each pair of the best-, intermediate-, and worst-performance blocks is plotted against the averaged number of errors in the block pair for the 69 cells. f, g, The deviation of the mean firing rate in each block from the overall mean of individual cells is plotted against the deviation of the number of errors in the block from the mean number of errors during the recording from the cell for preferred (f) and nonpreferred (g) rules. The deviation of firing rate was normalized by the mean firing rate. The r and p values in eg represent the correlation coefficient and the significance of the correlation, respectively.
Figure 5.
Figure 5.
Activity differences between correct and error trials in two PFC cells. a, b, The line graphs at the left show the averaged firing rates in correct and error trials, aligned at sample onset. The p values indicate the significance of effects of response type in a three-way ANOVA (rule × response type × epoch). The bin size is 50 ms. The raster grams in the middle show activity in individual correct and error trials of the first four blocks, also aligned at sample onset. The bar graph at the right represents the mean firing rate in the epoch noted above individual graphs for correct and error trials in consecutive blocks. The activity differences between correct and error trials were consistently seen in the same direction in consecutive color and shape blocks. Pink and black colors of lines, bars, and dots indicate correct and error trials, respectively. Vertical calibration bar, 5 spikes/s.
Figure 6.
Figure 6.
Activity difference between correct and error trials in another PFC cell. The notation is the same as that in Figure 5, except that pink and black colors indicate correct and error trials, respectively, in shape blocks, and red and blue colors indicate the same thing in color blocks. The p value indicates the significance of interaction between response type and rule in the three-way ANOVA (rule × response type × epoch).
Figure 7.
Figure 7.
Rule-dependent response to error-signal presentation. For a PFC cell, the perievent histogram is aligned at the error-signal onset and shows the average activity in error trials of color and shape blocks. The raster gram indicates activities in individual error trials, aligned at the error-signal onset. Each row corresponds to a trial, and each dot represents an action potential. This cell had a significant (paired t test, p < 0.01) response to the error-signal presentation in both color and shape blocks. The p value on the graph indicates the significance level (t test) for the difference in the magnitude of responses between color and shape blocks. The bin size is 50 ms. Red and black dots/traces indicate color and shape trials, respectively.
Figure 8.
Figure 8.
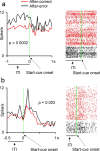
Dependence of activity on the success or failure in the preceding trial. a, b, For two PFC cells, the perievent histogram aligned at the start-cue onset shows the average activity in after-correct and after-error trials. The raster gram indicates activities in individual trials, aligned at the start-cue onset. Each row corresponds to a trial, and each dot represents an action potential. The p values in a and b indicate the significance level of the main effect of trial type in two-way ANOVA [trial type (after-correct/after-error) × rule] for ITI and start-cue epochs, respectively. The bin size is 50 ms. Red and black dots/traces indicate after-correct and after-error trials, respectively.

References

    1. Anderson SW, Damasio H, Jones RD, Tranel D (1991). Wisconsin Card Sorting Test performance as a measure of frontal lobe damage. J Clin Exp Neuropsychol 13:909–922. - PubMed
    1. Asaad WF, Rainer G, Miller EK (2000). Task-specific neural activity in the primate prefrontal cortex. J Neurophysiol 84:451–459. - PubMed
    1. Baeg EH, Kim YB, Huh K, Mook-Jung I, Kim HT, Jung MW (2003). Dynamics of population code for working memory in the prefrontal cortex. Neuron 40:177–188. - PubMed
    1. Barcelo F (1999). Electrophysiological evidence of two different types of error in the Wisconsin Card Sorting Test. NeuroReport 10:1299–1303. - PubMed
    1. Berg EA (1948). A simple objective test for measuring flexibility in thinking. J Gen Psychol 39:15–22. - PubMed

Publication types

MeSH terms

LinkOut - more resources