. 2006 May 15;573(Pt 1):173-85.
doi: 10.1113/jphysiol.2006.105809. Epub 2006 Mar 9.

Dynamic behaviour of half-sarcomeres during and after stretch in activated rabbit psoas myofibrils: sarcomere asymmetry but no 'sarcomere popping'

Affiliations

Dynamic behaviour of half-sarcomeres during and after stretch in activated rabbit psoas myofibrils: sarcomere asymmetry but no 'sarcomere popping'

I A Telley et al. J Physiol. .

Abstract

We examined length changes of individual half-sarcomeres during and after stretch in actively contracting, single rabbit psoas myofibrils containing 10-30 sarcomeres. The myofibrils were fluorescently immunostained so that both Z-lines and M-bands of sarcomeres could be monitored by video microscopy simultaneously with the force measurement. Half-sarcomere lengths were determined by processing of video images and tracking the fluorescent Z-line and M-band signals. Upon Ca2+ activation, during the rise in force, active half-sarcomeres predominantly shorten but to different extents so that an active myofibril consists of half-sarcomeres of different lengths and thus asymmetric sarcomeres, i.e. shifted A-bands, indicating different amounts of filament overlap in the two halves. When force reached a plateau, the myofibril was stretched by 15-20% resting length (L0) at a velocity of approximately 0.2 L0 s(-1). The myofibril force response to a ramp stretch is similar to that reported from muscle fibres. Despite the approximately 2.5-fold increase in force due to the stretch, the variability in half-sarcomere length remained almost constant during the stretch and A-band shifts did not progress further, independent of whether half-sarcomeres shortened or lengthened during the initial Ca2+ activation. Moreover, albeit half-sarcomeres lengthened to different extents during a stretch, rapid elongation of individual sarcomeres beyond filament overlap ('popping') was not observed. Thus, in contrast to predictions of the 'popping sarcomere' hypothesis, a stretch rather stabilizes the uniformity of half-sarcomere lengths and sarcomere symmetry. In general, the half-sarcomere length changes (dynamics) before and after stretch were slow and the dynamics after stretch were not readily predictable on the basis of the steady-state force-sarcomere length relation.


Figures

Figure 1
Figure 1. Epi-fluorescence images of single fluorescently labelled (psoas) myofibrils
A, image of a myofibril with 22 half-sarcomeres (11 sarcomeres). The image was recorded prior to Ca2+ activation. Half-sarcomeres are numbered from left to right (hS 1–21). hS 22 at the right end was not visible until active force elongated the series compliance of the attachment. Myofibril width is ∼1.2 μm. B, image of a myofibril consisting of 52 half-sarcomeres (numbered 1–52). The image was taken 80 ms after the Ca2+ application. The ‘dead’ half-sarcomeres (affected by manipulation or adhesive) between both attachment sites and hS 1 and 52, respectively, are indicated. Myofibril width is ∼1.6 μm. Each cross denotes the position of the fluorescent pattern of a Z-line (stronger signals) or M-band (weaker signals), except for the crosses at each ends in B, which denote approximately the position of the attachment sites. Half-sarcomere length (hSL) is calculated as the distance between consecutive positions of the intensities. Scale bars, 2 μm.
Figure 2
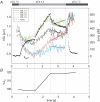
Figure 2. Force and half-sarcomere length changes during activation, stretch and relaxation
A, the force record (dotted line, right ordinate) and the length traces from four sequential half-sarcomeres (see key, left ordinate) from the myofibril shown in Fig. 1A. B, the relative length change of the whole myofibril (including functional and ‘dead’ hS) illustrating the ramp stretch of ∼20%L0. The calcium concentration is given by the black/grey bar on top and the vertical dashed lines indicate the onset of ramp-stretch (left), the end of ramp-stretch (middle) and the time of the Ca2+ removal (right). The rate constant of the Ca2+-induced force development (kACT) is ∼5.4 s−1. Note that half-sarcomeres shorten to different extents during the Ca2+-induced force development. During the stretch, half-sarcomeres lengthen but at variable rates. After the ramp stretch they show different behaviours at the stretched length, as shown by the fitted straight lines. On relaxation, half-sarcomeres returned to longer hSL as expected from the stretch applied to the myofibril.
Figure 3
Figure 3. Analysis of force, segment length and half-sarcomere length dynamics
Data from the myofibril shown in Fig. 1B. A, the upper panel shows the force transient recorded during activation, stretch and relaxation. The rate constant of force rise upon activation (kACT) was ∼5.2 s−1. The lower panel shows the length of the ‘dead’ hS of the preparation; note that this in-series non-linear viscoelasticity is extended during activation and stretch. B, thick line: mean hSL of the whole myofibril (52 functional hS +∼5 ‘dead’ hS) in absolute (left ordinate) and relative (right ordinate) units. Dotted line: mean hSL of the 52 functional hS; dashed and dotted line: mean of 26 hSL pooled from the two end regions; dashed line (with grey surround, s.e.m.): mean of 26 hSL in the mid-region. C and D, two neighbouring hSL (outlined and dashed) and their mean hSL (dotted). General presentation is similar to Fig. 2. Individual hSL just before and soon after changing from pCa 7.5 to 4.5 could not be determined due to out of focus images; however, mean resting hSL was ∼1.2 μm. Note that the different dynamic behaviour which neighbouring half-sarcomeres show after the ramp have no apparent correlation with their dynamic pre-history prior or during the stretch.
Figure 4
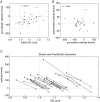
Figure 4. Analyses of filament sliding in individual half-sarcomeres
Scatter plots of the velocities of half-sarcomere length change (nm s−1) during the initial pre-stretch, the stretch and the post-stretch periods and the hSL at the beginning of each phase; data are from the middle 26 half-sarcomeres (hS 11–36) of the myofibril shown in Fig. 1B. Pearson's moment correlation coefficient r is given for the plots in A and B. A, scatter plot of pre-stretch velocity versus initial hSL exhibits a statistically significant correlation (P < 0.05), since the critical r value for a 5% significance level is 0.388. B, scatter plot of post-stretch versus pre-stretch velocities exhibits no correlation. C, scatter plot of the velocity during stretch versus hSL prior to stretch (*), and the post-stretch velocity versus hSL at the end of the stretch (^); a data pair is connected by a straight line to identify half-sarcomeres. The region between the vertical dotted lines (hSL = 1.0–1.2 μm) denotes the plateau region of the force versus half-sarcomere length relation. Note that all velocities are positive during stretch irrespective of the pre-stretch hSL (*): after the ramp stretch, the velocities are reduced to reach the longer hSL.
Figure 5
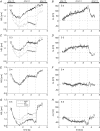
Figure 5. Sarcomere asymmetry during and after stretch
Half-sarcomere length traces (hSL, frames in the left column) and A-band shift (ΔL, frames in the right column) from four half-sarcomere pairs at the right end of a myofibril sharing an M-band (rows). The length of the corresponding sarcomeres is represented by the mean of the two halves (dotted). Sarcomeres are numbered according to the position in the myofibril (S 2–S 5, right to left), and the sides of the halves (right/left) are indicated in frame G. Vertical dashed lines indicate the times of onset and end of stretch and Ca2+ removal as in Fig. 2. Horizontal dashed lines in the right frames indicate the sarcomere centre where symmetry is achieved. During ramp stretch the rate of A-band drift decreases (positional changes either flatten or reverse). A-band shifts during contraction and stretch are generally slow compared with the fast recovery of sarcomere symmetry during relaxation.
Figure 6
Figure 6. The A-band dynamics (velocity) before, during and after stretch
An index of the velocity of A-band shift was determined from the fitted linear regressions as shown in Fig. 5 (right-hand frames). Mean values (^) with s.e.m. (bars) of the A-band velocities in sarcomeres (n = 20) from three different myofibrils during the three periods (pre-stretch, stretch, post-stretch) are shown. The higher velocity in the pre-stretch phase indicates considerable A-band drift away from the centre of the sarcomere. A paired t test showed that the velocity during stretch is smaller than that before stretch (P = 0.059); development of A-band displacement is therefore reduced during stretch. The post-stretch velocity did not significantly differ from the two other velocities, but tends to be in between.
Figure 7
Figure 7. Model simulation of responses of a myofibril during ramp stretch
Simulation of force and dynamics of a myofibril with 10 half-sarcomeres mechanically connected in series, according to the model of Telley et al. (2003). A, schematic diagram of a segment (half-sarcomere) of the multi-segmental mechanical model; it consists of an actomyosin element (AM) (that obeys force–velocity relation and steady-state force–hSL relation) coupled to a series elastic component (SE), and a parallel viscoelastic passive element (PE). For simulation, the model assumes a 15% variability (normally distributed) in hS force capacity i.e. in maximal isometric force (P0) of half-sarcomeres. B, force response of the myofibril during ramp stretch (1.5–2.5 s) of 21%L0 after end-held activation. The force reaches a peak of ∼2.5 times the isometric force at the end of stretch, and declines slowly after stretch but does not reach a steady state on the time scale adjusted to display the experimental data. Estimated final force is ∼10% higher than steady-state force during end-held contraction (2.5–3.5 s), indicated by the horizontal dotted lines. C, the dashed trace represents the externally applied ramp stretch. Selected length traces from four individual half-sarcomeres (outlined) show the general dynamic features observed in the experiments; thus, all half-sarcomeres elongate during stretch, but by different amounts (range 80–150% of imposed length change). The dynamics after stretch are slow and ‘creeping’; hS 1 and 2 remain almost isometric, hS 3 is further elongated (though operating on the plateau) and hS 4 shortens back on the ascending limb. Half-sarcomere lengths remain below ∼1.5 μm and hence the filament overlap is maintained.

Comment in

References

    1. Abbott BC, Aubert XM. Changes of energy in a muscle during very slow stretches. Proc R Soc Lond B Biol Sci. 1951;139:104–117. - PubMed
    1. Allinger TL, Epstein M, Herzog W. Stability of muscle fibers on the descending limb of the force-length relation. A theoretical consideration. J Biomech. 1996;29:627–633. - PubMed
    1. Bagni MA, Cecchi G, Colombini B, Colomo F. A non-cross-bridge stiffness in activated frog muscle fibers. Biophys J. 2002;82:3118–3127. - PMC - PubMed
    1. Brown LM, Hill L. Some observations on variations in filament overlap in tetanized muscle fibres and fibres stretched during a tetanus, detected in the electron microscope after rapid fixation. J Muscle Res Cell Motil. 1991;12:171–182. - PubMed
    1. Curtin NA, Davis RE. Chemical and mechanical changes during stretching of activated frog skeletal muscle. Cold Spring Harb Symp Quant Biol. 1973;37:619–626.

Publication types

LinkOut - more resources