

Tuning curves, neuronal variability, and sensory coding
- PMID: 16529529
- PMCID: PMC1403159
- DOI: 10.1371/journal.pbio.0040092
Tuning curves, neuronal variability, and sensory coding
Abstract
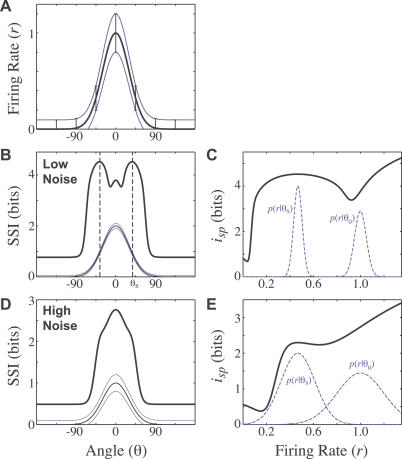
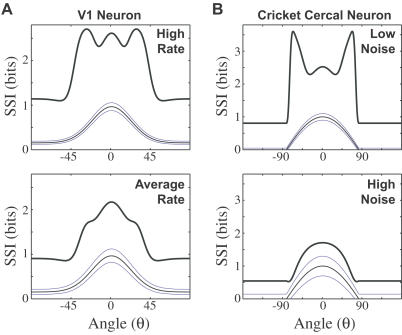
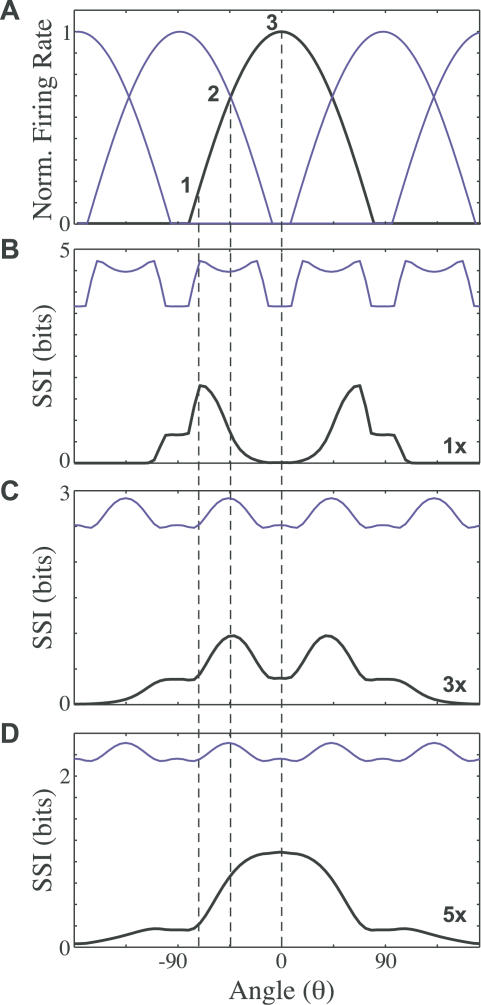
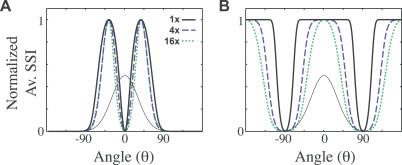
Tuning curves are widely used to characterize the responses of sensory neurons to external stimuli, but there is an ongoing debate as to their role in sensory processing. Commonly, it is assumed that a neuron's role is to encode the stimulus at the tuning curve peak, because high firing rates are the neuron's most distinct responses. In contrast, many theoretical and empirical studies have noted that nearby stimuli are most easily discriminated in high-slope regions of the tuning curve. Here, we demonstrate that both intuitions are correct, but that their relative importance depends on the experimental context and the level of variability in the neuronal response. Using three different information-based measures of encoding applied to experimentally measured sensory neurons, we show how the best-encoded stimulus can transition from high-slope to high-firing-rate regions of the tuning curve with increasing noise level. We further show that our results are consistent with recent experimental findings that correlate neuronal sensitivities with perception and behavior. This study illustrates the importance of the noise level in determining the encoding properties of sensory neurons and provides a unified framework for interpreting how the tuning curve and neuronal variability relate to the overall role of the neuron in sensory encoding.
Figures
Comment in
-
How do neurons look at the world?PLoS Biol. 2006 Apr;4(4):e122. doi: 10.1371/journal.pbio.0040122. Epub 2006 Apr 11. PLoS Biol. 2006. PMID: 16602828 Free PMC article.
-
Tuning in to how neurons distinguish between stimuli.PLoS Biol. 2006 Apr;4(4):e118. doi: 10.1371/journal.pbio.0040118. Epub 2006 Mar 21. PLoS Biol. 2006. PMID: 20076556 Free PMC article. No abstract available.
References
-
- Dayan P, Abbott LF. Theoretical neuroscience. Cambridge (Massachusetts): MIT Press; 2001. 576 pp.
-
- Bosking WH, Maunsell JH. The correlation between the firing of individual MT neurons and behavioral response across different directions of motion. Soc Neurosci Abs. 2004;31:935–937.
-
- Purushothaman G, Bradley DC. Neural population code for fine perceptual decisions in area MT. Nat Neurosci. 2005;8:99–106. - PubMed
Publication types
MeSH terms
LinkOut - more resources
Full Text Sources
