. 2006 Apr 24;24(17):3477-89.
doi: 10.1016/j.vaccine.2006.02.025. Epub 2006 Feb 28.

An effective cancer vaccine modality: lentiviral modification of dendritic cells expressing multiple cancer-specific antigens

Affiliations

An effective cancer vaccine modality: lentiviral modification of dendritic cells expressing multiple cancer-specific antigens

Bei Wang et al. Vaccine. .

Abstract

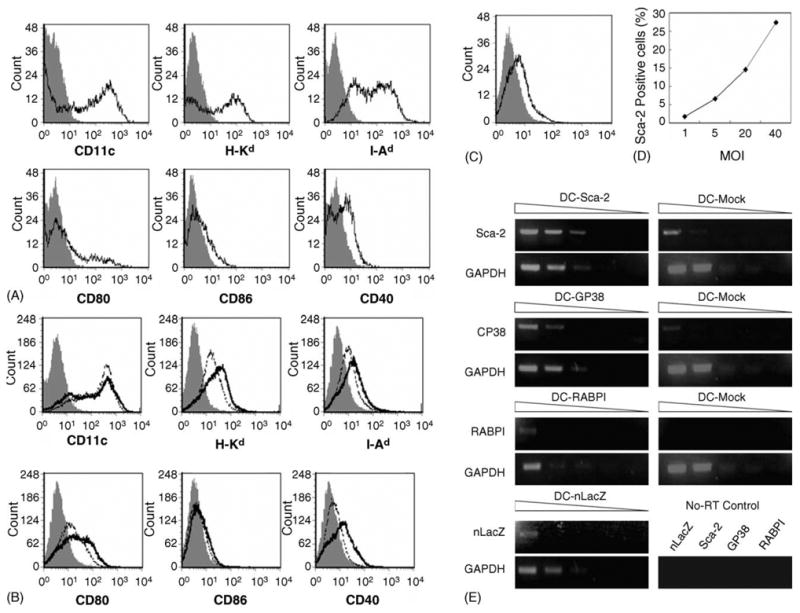
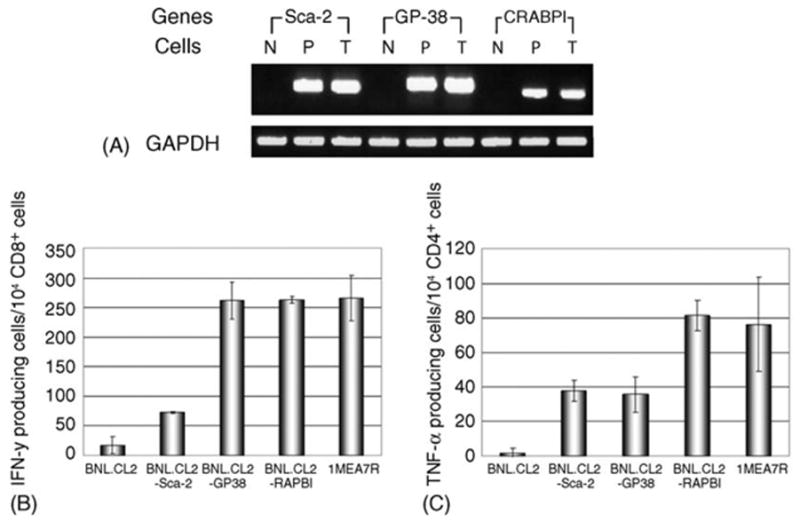
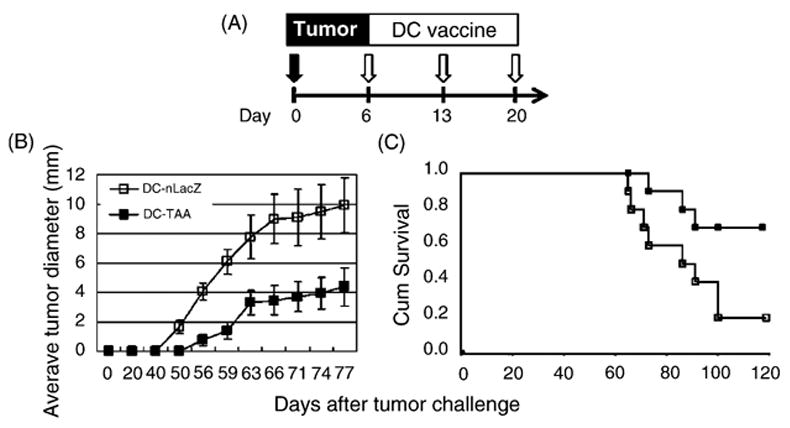
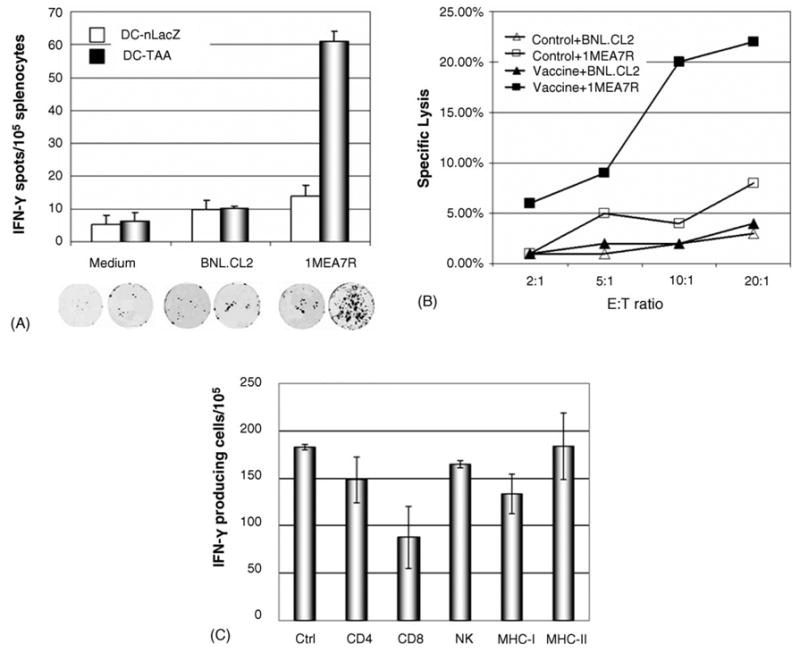
Viral modification of dendritic cells (DCs) may deliver a "danger signal" critical to the hypo-reactive DCs in cancer patients. Using three highly differentially expressed hepatoma tumor-associated antigens (TAAs): stem cell antigen-2 (Sca-2), glycoprotein 38 (GP38) and cellular retinoic acid binding protein 1 (RABP1), we explored the therapeutic potential of the DCs modified with lentiviral vectors (LVs). Preventive and therapeutic injection of the LV-TAA-DC vaccine into tumor-bearing mice elicited a strong anti-tumor response and extended survival, which was associated with tumor-specific interferon-gamma and cytotoxic T cell responses. In vivo elimination of the LV-TAA-DCs by a co-expressed thymidine kinase suicide gene abrogated the therapeutic effect. The modification of DCs with LVs encoding multiple TAAs offers a great opportunity in cancer immunotherapy.


Figures

Fig. 1
Fig. 1
An overview of multi-antigenic DC vaccine strategy. Highly differentially expressed murine hepatoma antigens were identified by the SSH cDNA cloning method. The full-length cDNA was cloned into the lentiviral pTYF vector. Lentiviral vectors encoding different TAAs were produced and used to co-transduce mouse bone marrow-derived immature DCs. The transduced DCs were harvested and used as anti-cancer vaccines.
Fig. 2
Fig. 2
Analysis of BMDC surface phenotype before and after LV-TAA transduction. DCs were generated form the bone marrow of Balb/c mice as described in Section 2. Immature DCs (day 7) were harvested and transduced with LVs. (A) Mouse BMDC phenotype analysis. The d7 BMDCs were collected and incubated with fluorescence-conjugated monoclonal Abs against murine CD 11c, H-2Kd (MHC class I), I-Ak (MHC class II), CD80, CD86 and CD40 for 30 min at 4 °C as indicated and analyzed by flow cytometry; shadowed area depicts isotype Ig control. (B) Mouse BMDC phenotype analysis after LV transduction. Forty-eight hours after transduction, DCs were incubated with fluorescence-conjugated Abs as indicated; shadowed area, isotype Ig control; dotted line, mock-transduced DCs; solid line, LV-TAA-DCs. (C) Flow cytometry analysis of BMDCs transduced by LV-Sca-2 (MOI = 40). (D) Quantitative analysis of LV-Sca-2 expression in DCs. Day 7 DCs were transduced with different MOI of LV-Sca-2: 1, 5, 20 and 40. Four days after transduction, the DCs were harvested and stained with FITC-conjugated Ab against murine Sca-2 and the transduction efficiency was analyzed by flow cytometry. The graphs were representative of two repeated experiments. (E) Semi-quantitative analysis of LV-TAA expression in BMDCs. Day 5 mBMDCs were transduced with LV-Sca-2, LV-GP38, LV-RABP1 or LV-nLacZ. The total cellular RNA was harvested 48 h later, reverse transcribed and amplified after serial dilution (1, 1/10, 1/100, 1/1000 and 0) using gene-specific primers. RT-PCR of GAPDH RNA was included as internal control. No-RT control was done using 500 ng RNA in stead of cDNA. Same amount of PCR products were loaded and run in 1% agarose gel.
Fig. 3
Fig. 3
Analysis of in vivo immunogenicity of LV-TAA-DCs. (A) Expression of TAAs in LV-transduced BNL.CL2 cells. Normal hepatocytes (BNL.CL2) were transduced with LV-Sca-2, LV-GP38 or LV-RABP1. The level of transgene expression was determined by RT-PCR using total cellular RNA and the TAA gene-specific primers as depicted. N, negative control (BNL.CL2); P, positive control (1MEA7R); T, transduced BNL.CL2. RT-PCR of GAPDH RNA was included as control. (B) and (C) Analysis of cell-mediated immue response by intracellular cytokine staining. Balb/c mice were injected with the LV-TAA-DCs twice in weekly intervals and the splenocytes (1 × 10⁶) of five mice were pooled and stimulated for 16 h with 2 × 10⁵ BNL.CL2, BNL.CL2 transduced with a LV-TAA or 1MEA7R cells. The intracellular IFN-γ or TNF-α was stained using specific Abs; left panel represents CD8 T cells and IFN-γ staining, and right panel CD4 T cells and TNFa staining. Error bars depict standard deviations (S.D.) of three independent experiments.
Fig. 4
Fig. 4
In vivo protective immunity against tumor challenge by prophylactic immunization with LV-TAA-DCs. (A) DC immunization and tumor injection scheme. Balb/c mice (10 per group) were immunized s.c. with nLacZ-DCs or LV-TAA-DCs weekly for 3 weeks at a dose of 5 × 10⁵ DCs/injection. Seven days after immunization, the mice were injected s.c. with 5 × 10⁵ of 1MEA7R hepatoma cells. (B) Representative tumor size in mice at endpoints; scale is shown in cm. (C) Tumor growth kinetics. The tumor size was measured over time using caliper and the mean tumor diameter (in mm) was determined. Error bars depict standard deviation (S.D.), n = 10. The LV-TAA-DC vaccines resulted in statistically significant protection compared to the control nLacZ-DCs after day 14 (P < 0.01). (D) Survival Kaplan–Meier curves. The curves were generated from the survival data (n = 10).
Fig. 5
Fig. 5
Suppression of the tumor growth and extension of the survival of tumor-bearing mice after LV-TAA-DC immunization. (A) Tumor implantation and DC immunization scheme. The mice, 10 per group, were inoculated s.c. with 2 × 10⁵ hepatoma cells on day 0, and on day 6 the mice received 5 × 10⁵LV-TAA-DCs or nLacZ-DCs weekly for 3 weeks. (B) Tumor growth kinetics. The measurement was made when the tumor was palpable; error bars depict SD. (C) Kaplan–Meier survival plots. The plots were generated from the survival data, n = 10 per group. Mice that became moribund were killed. Data are representative of two independent experiments.
Fig. 6
Fig. 6
In vivo migration and knockout kinetic study of the injected LV-DCs. (A) Detection of LV-GFP expression in the injected DCs after migration to the draining lymph nodes and the spleen. The draining lymph nodes and the spleen were harvested 24 or 48 h after injection and analyzed by flow cytometry for GFP-positive cells. (B) Kaplan–Meier survival plots of mice with or without the knockout the LV-TAA-DC in 48 h. The mice were inoculated with 1MEA7R tumor cells, and 1 week later, vaccinated with DC-nLacZ, DC-TAA or DC-TAA-TK. Forty-eight hours after vaccination, the DC-TAA-TK injected mice were treated with GCV i.p. for 3 days. The plots were generated from the survival data, n = 5 per group.
Fig. 7
Fig. 7
Immunohistochemical staining of tumor infiltrating T cells and histological evaluation of organs of the vaccinated mice. (A) Immunohistochemical staining of tumor infiltrating T lymphocytes. The paraffin-embedded tissue sections were prepared and stained with monoclonal anti-CD3 antibody as described in Section 2. The left panel showed tumors from the control mice, and the right panel from the LV-TAA-DC vaccinated mice. (B) H&E and infiltrating T cell staining in liver and lung of the LV-TAA-DC vaccinated mice. The upper panel represents H&E staining and the lower panel anti-CD3 antibody staining.
Fig. 8
Fig. 8
Analyses of tumor-specific immune response in the LV-TAA-DC-immunized mice. (A) ELISPOT assays for immune cells releasing IFN-γ. Splenocytes harvested from the DC-injected mice were restimulated with medium alone, 1MEA7R hepatoma cells or BNL.CL2 normal hepatocytes. 1MEA7R or BNL.CL2 cells were cultured with splenocytes at 1:5 ratios for 24 h at 37 °C, and the IFN-γ-secreting cells (spots) were visualized and quantified. The column represents the average of counted spots per well which was normalized against background from three independent experiments with S.D. error bars. Representative spot-containing wells are shown below each corresponding column. (B) FATAL assay for anti-cancer cytotoxicity. The splenocytes were restimulated for 5 days with irradiated 1MEA7R tumor cells. The FATAL assays, as described in Section 2, were performed to evaluate the cytotoxic activity against 1MEA7R and BNL.CL2 cells. The representative of three experiments is shown. (C) In vitro antibody blocking experiments. The pooled splenocytes (1 × 10⁶) were pre-incubated with blocking antibodies for 1 h at 37 °C as indicated at bottom of the graph, and then stimulated with 1MEA7R (2 × 10⁵) for 16 h and treated with Brefeldin A. Intracellular IFN-γ was stained and analyzed by FACS. The experiments were repeated three times and presented with S.D. error bars. Student’s t-test was performed with P < 0.05 for CD8 and MHC I, and P < 0.08 for CD4 and NK.

Similar articles

Cited by

References

    1. Esche C, Shurin MR, Lotze MT. The use of dendritic cells for cancer vaccination. Curr Opin Mol Ther. 1999;1(1):72–81. - PubMed
    1. Kirk CJ, Mule JJ. Gene-modified dendritic cells for use in tumor vaccines. Hum Gene Ther. 2000;11(6):797–806. - PubMed
    1. Schuler G, Schuler-Thurner B, Steinman RM. The use of dendritic cells in cancer immunotherapy. Curr Opin Immunol. 2003;15(2):138–47. - PubMed
    1. Ridgway D. The first 1000 dendritic cell vaccinees. Cancer Invest. 2003;21(6):873–86. - PubMed
    1. Banchereau J, Palucka AK. Dendritic cells as therapeutic vaccines against cancer. Nat Rev Immunol. 2005;5(4):296–306. - PubMed

Publication types

MeSH terms