. 2006 Apr;18(4):992-1007.
doi: 10.1105/tpc.105.040121. Epub 2006 Mar 10.

A soluble carotenoid protein involved in phycobilisome-related energy dissipation in cyanobacteria

Affiliations

A soluble carotenoid protein involved in phycobilisome-related energy dissipation in cyanobacteria

Adjélé Wilson et al. Plant Cell. 2006 Apr.

Abstract

Photosynthetic organisms have developed multiple protective mechanisms to survive under high-light conditions. In plants, one of these mechanisms is the thermal dissipation of excitation energy in the membrane-bound chlorophyll antenna of photosystem II. The question of whether or not cyanobacteria, the progenitor of the chloroplast, have an equivalent photoprotective mechanism has long been unanswered. Recently, however, evidence was presented for the possible existence of a mechanism dissipating excess absorbed energy in the phycobilisome, the extramembrane antenna of cyanobacteria. Here, we demonstrate that this photoprotective mechanism, characterized by blue light-induced fluorescence quenching, is indeed phycobilisome-related and that a soluble carotenoid binding protein, ORANGE CAROTENOID PROTEIN (OCP), encoded by the slr1963 gene in Synechocystis PCC 6803, plays an essential role in this process. Blue light is unable to quench fluorescence in the absence of phycobilisomes or OCP. The fluorescence quenching is not DeltapH-dependent, and it can be induced in the absence of the reaction center II or the chlorophyll antenna, CP43 and CP47. Our data suggest that OCP, which strongly interacts with the thylakoids, acts as both the photoreceptor and the mediator of the reduction of the amount of energy transferred from the phycobilisomes to the photosystems. These are novel roles for a soluble carotenoid protein.


Figures

Figure 1.
Figure 1.
Mutant Construction and Segregation in the Synechocystis PCC 6803 Genome. (A) Gene arrangement of the slr1963 (encoding the OCP) and slr1964 genes. The positions of the oligonucleotides used for amplification and the restriction sites are indicated. In the ΔOCP strain, the slr1963 gene was disrupted by insertion of the spectinomycin and streptomycin (Sp/Sm) resistance cassette. In the Δslr1964 strain, the Sp/Sm resistance cassette interrupted slr1964. In the OCP-GFP mutant, the GFP gene was fused to the C terminus of the OCP and the slr1964 gene was disrupted by the Sp/Sm resistance gene. (B) Amplification of genomic Synechocystis DNA from the OCP-GFP mutant (lane 1), the wild type (lane 2), the ΔOCP mutant (lane 3), and the ΔSlr1964 mutant (lane 4) using car1 and car6 as primers. Lanes 5 and 6 show the PCR fragments obtained by amplification of slr1963 from the ΔSlr1964 strain (lane 5) and from the ΔOCP mutant (lane 6) with car1 and car2 as primers. MW, 1-kb DNA ladder. (C) Digestion of the 2- and 4-kb PCR fragments obtained using wild-type (lane 1), ΔOCP (lane 2), and ΔSlr1964 (lane 3) DNA as templates by the restriction enzyme HincII.
Figure 2.
Figure 2.
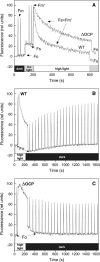
Changes in Fluorescence Levels Induced by Different Intensities of White Light Measured in a PAM Fluorometer. (A) Dark-adapted wild-type and ΔOCP cells (3 μg chlorophyll/mL) were successively illuminated with white light at 50 μmol·m−2·s−1 followed by white light at 1500 μmol·m−2·s−1. Saturating pulses (1-s duration, 2000 μmol·m−2·s−1) were applied to measure Fm and Fm′ levels in darkness and in dim light, respectively. Under high-intensity light illumination, all centers were closed (Fs = Fm′) and saturating flashes were not applied. (B) and (C) Dark-adapted cells of the wild type (B) and ΔOCP (C) were illuminated directly with high white light (1500 μmol·m−2·s−1 ) for 2 min and then incubated in darkness. During dark incubation, saturating pulses were applied to measure Fm levels. Chloramphenicol was present during all experiments.
Figure 3.
Figure 3.
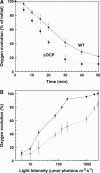
Photoinhibition: Effect of High Intensities of White Light on Oxygen Evolution in Wild-Type and ΔOCP Cells. (A) Decrease of oxygen evolution induced in wild-type (circles) and ΔOCP (squares) cells (10 μg chlorophyll/mL) by exposure to white light (three lamps of 1000 μmol·m−2·s−1 each). Error bars represent se from three independent experiments. One hundred percent of oxygen-evolving activity was 207 ± 5 μmol O2·h−1·mg chlorophyll−1 in the wild type and 213 ± 6 μmol O2·h−1·mg chlorophyll−1 in the ΔOCP mutant. (B) Saturation light curves of oxygen evolution activity in control wild-type cells (closed circles) and in 10-min photoinhibited wild-type cells (open circles). The photoinhibited cells were incubated on ice until measurement. Error bars represent se from four independent experiments. One hundred percent of the oxygen-evolving activity was 205 ± 5 μmol O2·h−1·mg chlorophyll−1 in control cells and 160 ± 5 μmol O2·h−1·mg chlorophyll−1 in photoinhibited cells.
Figure 4.
Figure 4.
Effect of the OCP on the Development of Blue-Green Light–Induced NPQ and on State Transitions. (A) to (C) Measurements of fluorescence yield by a PAM fluorometer in dark-adapted wild-type (A), ΔOCP (B), and ΔSlr1964 (C) cells illuminated successively with low-intensity blue-green light (400 to 550 nm, 80 μmol·m−2·s−1 ) and high-intensity blue-green light (740 μmol·m−2·s−1). (D) and (E) Measurements of fluorescence yield by a PAM fluorometer in dark-adapted wild-type (D) and ΔOCP (E) cells illuminated successively with low-intensity blue-green light (400 to 550 nm, 80 μmol·m−2·s−1) and orange light (600 to 650 nm, 20 μmol·m−2·s−1). Blue-green illumination induced the state 1 transition (high fluorescence state), and then orange illumination induced the state 2 transition (low fluorescence state). Saturating pulses separated by 30 s were applied to assess Fm′.
Figure 5.
Figure 5.
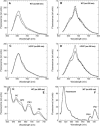
Involvement of Phycobilisomes in Thermal Energy Dissipation. (A) to (D) Room temperature fluorescence spectra of dark-adapted wild-type and ΔOCP cells (solid lines) and after 5 min of high-intensity blue-green light illumination (dashed lines). (E) and (F) 77K fluorescence spectra of wild-type cells after 5 min of illumination with low-intensity (gray lines) and high-intensity (dashed lines) blue-green light. These spectra were normalized to fluorescence emitted by known concentrations of phycoerythrin (PE; excitation, 600 nm) or fluorescein (excitation, 430 nm) added to the samples just before recording the spectra. APC, allophycocyanin; PC, phycocyanin. Each spectrum shown is the mean of 12 spectra from three independent experiments (mean of four spectra per experiment). Excitation was performed at 600 nm ([A], [C], and [E]) and at 430 nm ([B], [D], and [F]).
Figure 6.
Figure 6.
Strong Blue-Green Light Effect in Different Phycobilisome Mutants. Measurements of fluorescence yield by a PAM fluorometer in dark-adapted CK ([A]; phycocyanin-deficient mutant), CK-ΔOCP (B), ΔAB ([C]; allophycocyanin-deficient mutant), and PAL ([D]; phycobilisome-deficient mutant) cells illuminated successively with low-intensity blue-green light (400 to 550 nm, 80 μmol·m−2·s−1; for PAL, 300 μmol·m−2·s−1) and high-intensity blue-green light (740 μmol·m−2·s−1; for PAL, 1700 μmol·m−2·s−1).
Figure 7.
Figure 7.
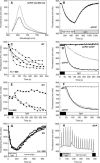
Blue-Green Light–Induced OCP-Related Fluorescence Quenching in ΔCP47 and ΔIsiA Mutant Cells. (A) Room temperature fluorescence spectra of control (solid line) and quenched (dashed line) ΔCP47 cells. Excitation was performed at 600 nm. (B) Fluorescence level changes in dark-adapted cells of the ΔCP47 mutant during successive illumination by high blue-green light followed by dark incubation for fluorescence recovery. (C) Wild-type cells adapted to low blue-green light intensities (high fluorescence state) were illuminated with strong blue-green light (400 to 550 nm) at 300 (circles), 470 (squares), and 730 (diamonds) μmol·m−2·s−1 or with green light (500 to 550 nm, 510 μmol·m−2·s−1; triangles) to induce the quenched state. (D) Fluorescence level changes in dark-adapted ΔCP47 mutant cells during illumination at 150 (dashed line), 350 (dotted line), and 1000 (solid line) μmol·m−2·s−1 blue-green light and in dark-adapted ΔCP47-ΔOCP mutant cells during illumination at 1000 μmol·m−2·s−1 blue-green light (solid line). The ΔCP47 and ΔCP47-ΔOCP mutants lack variable fluorescence because of the absence of PSII reaction centers. (E) Dark-adapted wild-type cells were illuminated with orange-red (600 to 650 nm; squares), blue-green (400 to 550 nm; circles), or green (triangles) light at 470 μmol·m−2·s−1. Saturating pulses separated by 30 s were applied to assess Fm′. The orange-red light at this intensity closed 95% of PSII centers, whereas blue-green and green light closed only 20 and 10% of centers, respectively. (F) Fluorescence level changes in dark-adapted ΔCP47 cells illuminated by orange-red (600 to 700 nm, 3000 μmol·m−2·s−1; dashed line), green (500 to 550 nm, 470 μmol·m−2·s−1; dotted line), and blue-green (400 to 550 nm, 470 μmol·m−2·s−1; solid line) light. (G) Measurements of fluorescence yield by a PAM fluorometer for wild-type cells adapted to low blue-green light intensities (high fluorescence state) in the presence of DCMU (solid line), nigericin (squares), or without additions (circles) illuminated for 200 s with strong blue-green light (740 μmol·m−2·s−1 ) to induce the quenched state and then illuminated with low blue-green light (80 μmol·m−2·s−1) to allow fluorescence recovery. (H) Measurements of fluorescence yield by a PAM fluorometer for dark-adapted ΔIsiA cells illuminated successively with low-intensity blue-green light (400 to 550 nm, 80 μmol·m−2·s−1) and high-intensity blue-green light (740 μmol·m−2·s−1).
Figure 8.
Figure 8.
In Situ Localization of the OCP-GFP Fusion Protein. (A) Distribution of green fluorescence. Phase contrast (left), GFP fluorescence (middle), and chlorophyll and phycobiliprotein fluorescence (right) micrographs of OCP-GFP (row 1) and wild-type (row 2) cells are shown. Bar = 3 μm. (B) Histogram of gold particle density in whole cells (bar 1), interthylakoid region (bar 2), and non-thylakoid-related cytoplasm (bar 3). Thirty-three cells were analyzed and 1120 gold particles were counted. On average, the thylakoid region represents 65% of the cellular surface. Error bars indicate se. (C) Immunogold labeling of a thin section of OCP-GFP–transformed cells. Panel 1, OCP-GFP cells were labeled with a polyclonal antibody against the GFP coupled to 10-nm gold particles; panel 2, no labeling was observed without the primary antibody. Bar = 0.5 μm.
Figure 9.
Figure 9.
GFP Fluorescence Measurement, Gel Electrophoresis, and Protein Gel Blot Analysis of Soluble and Membrane Fractions. (A) Fluorescence emission spectra. GFP emission in the membrane fractions MP (for membrane-bound phycobilisomes) and M (for membrane-free phycobilisomes) at 4 μg chlorophyll/mL and the soluble fractions sup MES (for MES supernatant) and sup P/C (for phosphate-citrate supernatant) at a concentration corresponding to that of the membrane fractions (see Methods). Excitation was at 480 nm. Values shown are means of four independent experiments. (B) Fluorescence emission spectra. GFP in the MP fraction (3.5 μg chlorophyll/mL) and in the M and phycobilisome (PBS) fractions obtained after suspension of the MP fraction in MES buffer (1-h incubation) and subsequent centrifugation. Values shown are means of three different experiments. (C) Coomassie blue–stained gel electrophoresis and immunoblot detection of the OCP-GFP fusion protein of the M fraction (lane 1), the MP fraction (lane 2), and the soluble fractions of cells broken in P/C buffer (lane 4) and MES (lane 5); lane 3, molecular mass markers. In the immunoblot (lane 3), the heavy chain of the mouse IgG is visualized. (D) Coomassie blue–stained gel electrophoresis and immunoblot detection of the OCP-GFP fusion protein of the MP (lanes 2 and 4) and M (lanes 1 and 5) fractions solubilized for 3 min at 95°C (lanes 1 and 2) or for 20 min at 4°C (lanes 4 and 5); lane 3, molecular mass markers. In the immunoblot (lane 3), the heavy chain of the mouse IgG is visualized. Each slot contained 2 μg of chlorophyll of the MP or M fraction or the corresponding volumes of the supernatants (see Methods). The relationship between the volumes of membrane and soluble fractions was the same for the fluorescence spectra and gels.

References

    1. Adir, N. (2005). Elucidation of the molecular structures of components of the phycobilisome: Reconstructing a giant. Photosynth. Res. 85 15–32. - PubMed
    1. Ajlani, G., and Vernotte, C. (1998). Construction and characterization of a phycobiliprotein-less mutant of Synechocystis sp. PCC 6803. Plant Mol. Biol. 37 577–580. - PubMed
    1. Ajlani, G., Vernotte, C., DiMagno, L., and Haselkorn, R. (1995). Phycobilisome core mutants of Synechocystis PCC 6803. Biochim. Biophys. Acta 1231 189–196.
    1. Allen, J.F. (1992). Protein phosphorylation in regulation of photosynthesis. Biochim. Biophys. Acta 1098 275–335. - PubMed
    1. Aro, E.M., Virgin, I., and Andersson, B. (1993). Photoinhibition of photosystem II. Inactivation, protein damage and turnover. Biochim. Biophys. Acta 1143 113–134. - PubMed

Publication types

LinkOut - more resources