

Quantitative analysis of associations between DNA hypermethylation, hypomethylation, and DNMT RNA levels in ovarian tumors
- PMID: 16532039
- PMCID: PMC1449872
- DOI: 10.1038/sj.onc.1209145
Quantitative analysis of associations between DNA hypermethylation, hypomethylation, and DNMT RNA levels in ovarian tumors
Abstract
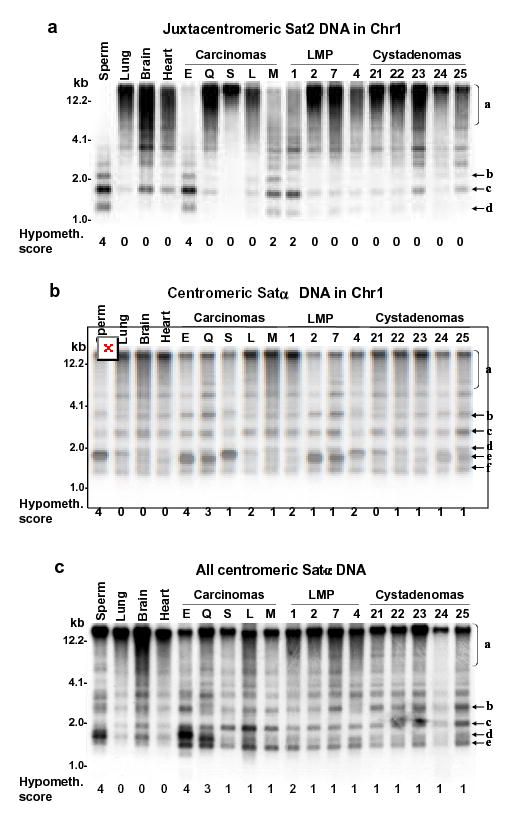
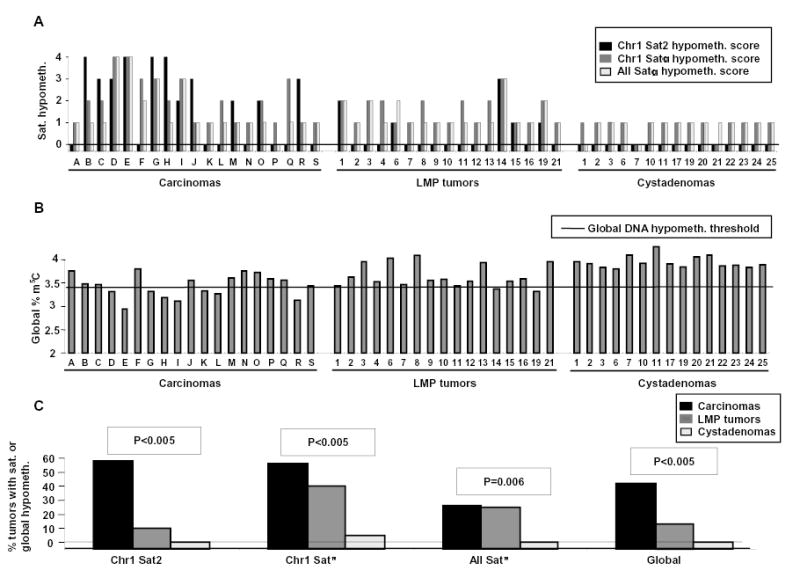
How hypermethylation and hypomethylation of different parts of the genome in cancer are related to each other and to DNA methyltransferase (DNMT) gene expression is ill defined. We used ovarian epithelial tumors of different malignant potential to look for associations between 5'-gene region or promoter hypermethylation, satellite, or global DNA hypomethylation, and RNA levels for ten DNMT isoforms. In the quantitative MethyLight assay, six of the 55 examined gene loci (LTB4R, MTHFR, CDH13, PGR, CDH1, and IGSF4) were significantly hypermethylated relative to the degree of malignancy (after adjustment for multiple comparisons; P < 0.001). Importantly, hypermethylation of these genes was associated with degree of malignancy independently of the association of satellite or global DNA hypomethylation with degree of malignancy. Cancer-related increases in methylation of only two studied genes, LTB4R and MTHFR, which were appreciably methylated even in control tissues, were associated with DNMT1 RNA levels. Cancer-linked satellite DNA hypomethylation was independent of RNA levels for all DNMT3B isoforms, despite the ICF syndrome-linked DNMT3B deficiency causing juxtacentromeric satellite DNA hypomethylation. Our results suggest that there is not a simple association of gene hypermethylation in cancer with altered DNMT RNA levels, and that this hypermethylation is neither the result nor the cause of satellite and global DNA hypomethylation.
Figures
References
-
- Agoston AT, Argani P, Yegnasubramanian S, De Marzo AM, Ansari-Lari MA, Hicks JL, Davidson NE, Nelson WG. J Biol Chem. 2005;280:18302–18310. - PubMed
-
- Ahluwalia A, Yan P, Hurteau JA, Bigsby RM, Jung SH, Huang TH, Nephew KP. Gynecol Oncol. 2001;82:261–268. - PubMed
-
- Benjamini Y, Drai D, Elmer G, Kafkafi N, Golani I. Behav Brain Res. 2001;125:279–284. - PubMed
Publication types
MeSH terms
Substances
Grants and funding
LinkOut - more resources
Full Text Sources
Other Literature Sources
Medical
Research Materials
Miscellaneous
