

Circadian clocks are resounding in peripheral tissues
- PMID: 16532060
- PMCID: PMC1391918
- DOI: 10.1371/journal.pcbi.0020016
Circadian clocks are resounding in peripheral tissues
Abstract
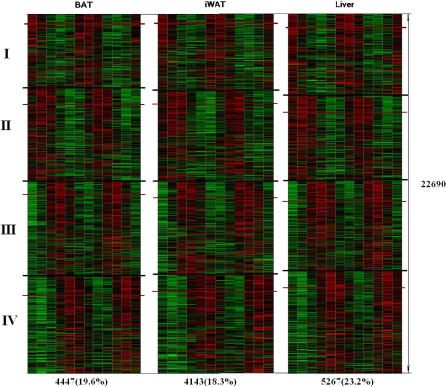
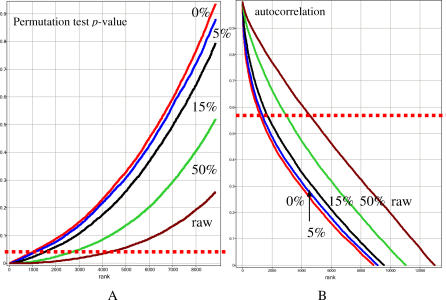
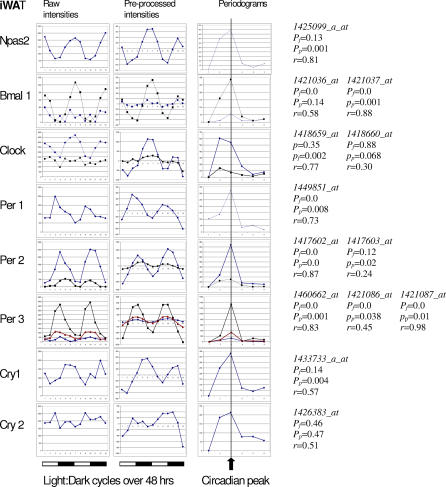
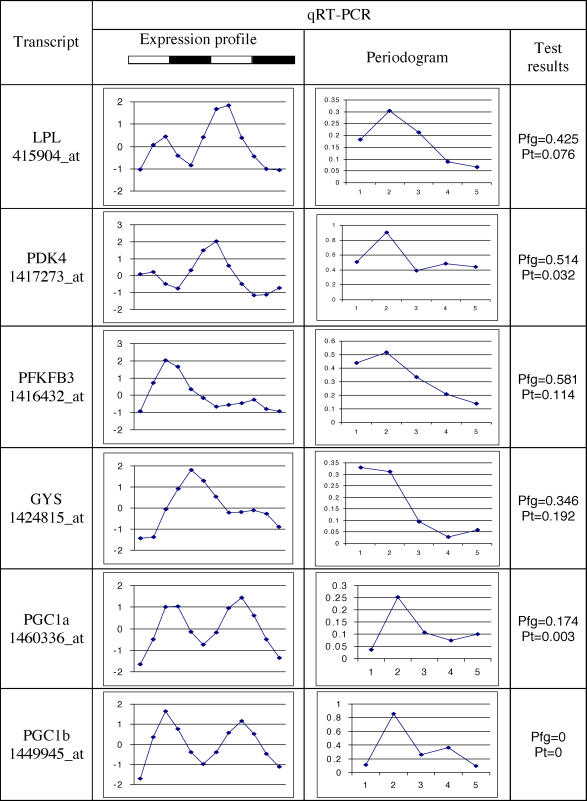
Circadian rhythms are prevalent in most organisms. Even the smallest disturbances in the orchestration of circadian gene expression patterns among different tissues can result in functional asynchrony, at the organism level, and may to contribute to a wide range of physiologic disorders. It has been reported that as many as 5%-10% of transcribed genes in peripheral tissues follow a circadian expression pattern. We have conducted a comprehensive study of circadian gene expression on a large dataset representing three different peripheral tissues. The data have been produced in a large-scale microarray experiment covering replicate daily cycles in murine white and brown adipose tissues as well as in liver. We have applied three alternative algorithmic approaches to identify circadian oscillation in time series expression profiles. Analyses of our own data indicate that the expression of at least 7% to 21% of active genes in mouse liver, and in white and brown adipose tissues follow a daily oscillatory pattern. Indeed, analysis of data from other laboratories suggests that the percentage of genes with an oscillatory pattern may approach 50% in the liver. For the rest of the genes, oscillation appears to be obscured by stochastic noise. Our phase classification and computer simulation studies based on multiple datasets indicate no detectable boundary between oscillating and non-oscillating fractions of genes. We conclude that greater attention should be given to the potential influence of circadian mechanisms on any biological pathway related to metabolism and obesity.
Conflict of interest statement
Figures
References
-
- Albrecht U, Eichele G. The mammalian circadian clock. Curr Opin Genet Dev. 2003;13:271–277. - PubMed
-
- Hogenesch JB, Panda S, Kay S, Takahashi JS. Circadian transcriptional output in the SCN and liver of the mouse. Novartis Found Symp. 2003;253:171–180. - PubMed
-
- Storch KF, Lipan O, Leykin I, Viswanathan N, Davis FC, et al. Extensive and divergent circadian gene expression in liver and heart. Nature. 2002;417:78–83. - PubMed
-
- Ueda HR, Chen W, Adachi A, Wakamatsu H, Hayashi S, et al. A transcription factor response element for gene expression during circadian night. Nature. 2002;418:534–539. - PubMed
-
- Wichert S, Fokianos K, Strimmer K. Identifying periodically expressed transcripts in microarray time series data. Bioinformatics. 2004;20:5–20. - PubMed
Publication types
MeSH terms
LinkOut - more resources
Full Text Sources
Other Literature Sources
