

An evaluation of the performance of tag SNPs derived from HapMap in a Caucasian population
- PMID: 16532062
- PMCID: PMC1391920
- DOI: 10.1371/journal.pgen.0020027
An evaluation of the performance of tag SNPs derived from HapMap in a Caucasian population
Abstract
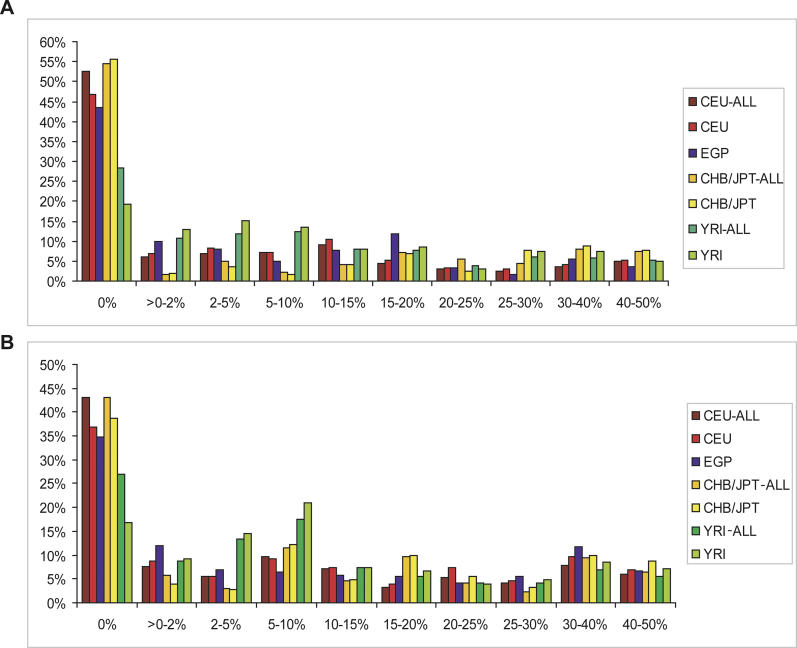
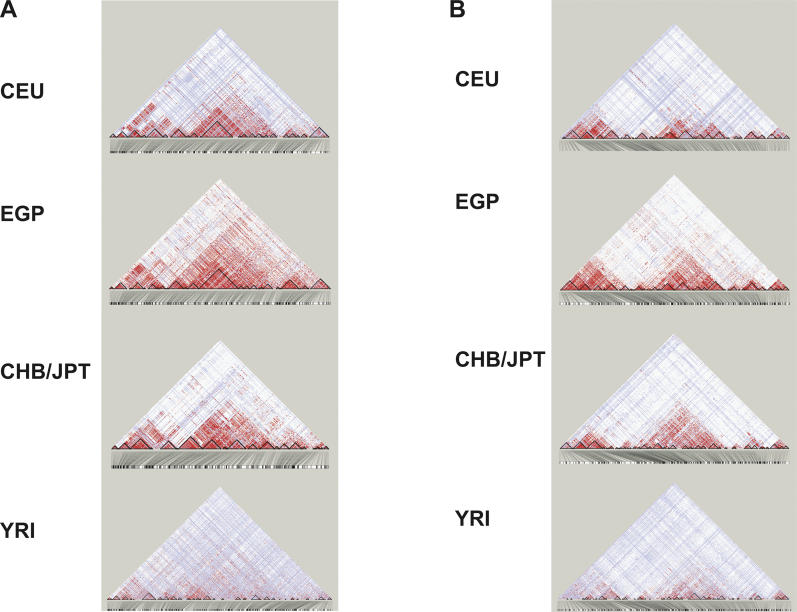
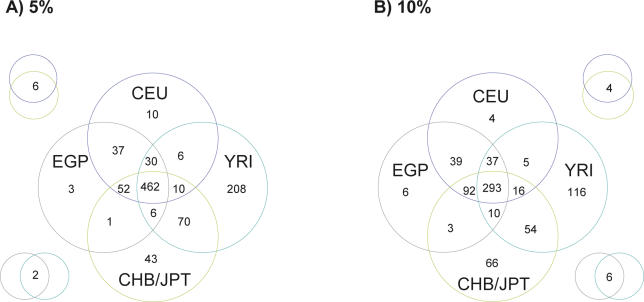
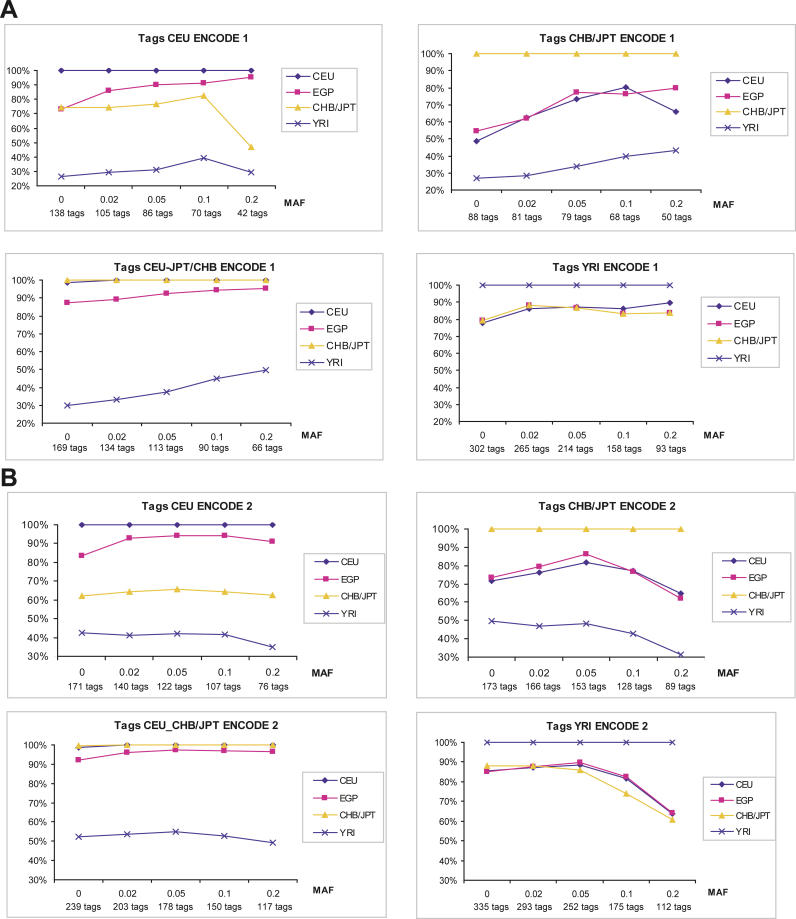
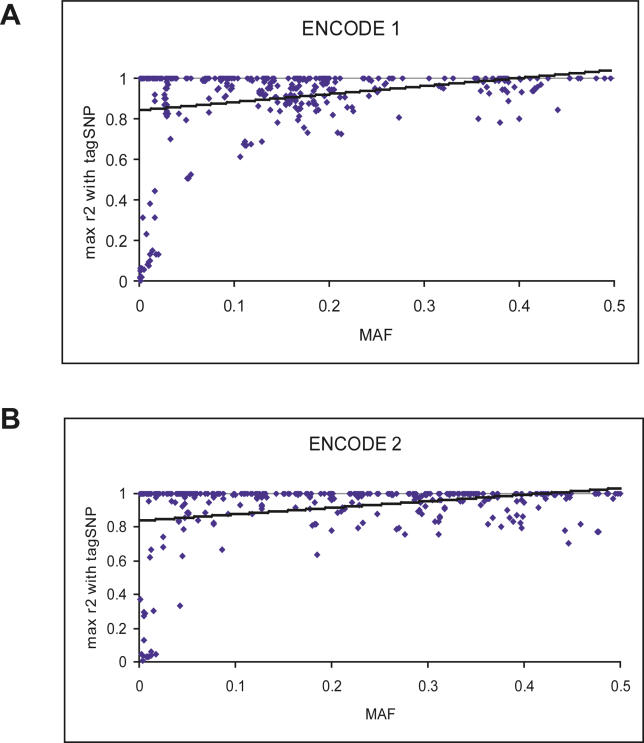
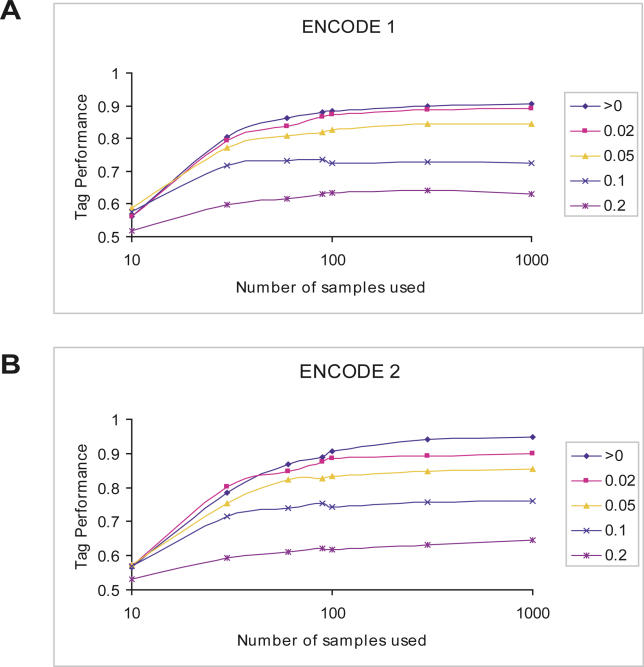
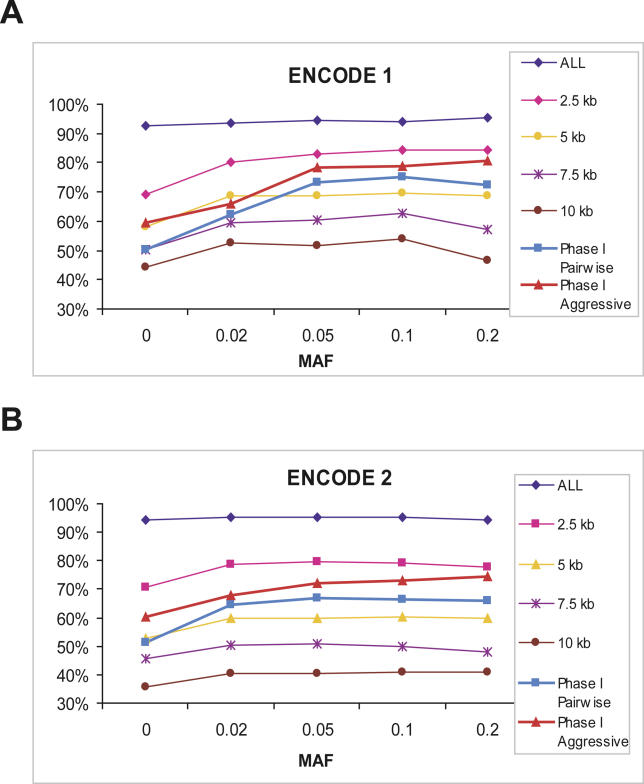
The Haplotype Map (HapMap) project recently generated genotype data for more than 1 million single-nucleotide polymorphisms (SNPs) in four population samples. The main application of the data is in the selection of tag single-nucleotide polymorphisms (tSNPs) to use in association studies. The usefulness of this selection process needs to be verified in populations outside those used for the HapMap project. In addition, it is not known how well the data represent the general population, as only 90-120 chromosomes were used for each population and since the genotyped SNPs were selected so as to have high frequencies. In this study, we analyzed more than 1,000 individuals from Estonia. The population of this northern European country has been influenced by many different waves of migrations from Europe and Russia. We genotyped 1,536 randomly selected SNPs from two 500-kbp ENCODE regions on Chromosome 2. We observed that the tSNPs selected from the CEPH (Centre d'Etude du Polymorphisme Humain) from Utah (CEU) HapMap samples (derived from US residents with northern and western European ancestry) captured most of the variation in the Estonia sample. (Between 90% and 95% of the SNPs with a minor allele frequency of more than 5% have an r2 of at least 0.8 with one of the CEU tSNPs.) Using the reverse approach, tags selected from the Estonia sample could almost equally well describe the CEU sample. Finally, we observed that the sample size, the allelic frequency, and the SNP density in the dataset used to select the tags each have important effects on the tagging performance. Overall, our study supports the use of HapMap data in other Caucasian populations, but the SNP density and the bias towards high-frequency SNPs have to be taken into account when designing association studies.
Conflict of interest statement
Competing interests. The authors have declared that no competing interests exist.
Figures
References
-
- The International HapMap Consortium. The International HapMap Project. Nature. 2003;426:789–796. - PubMed
-
- Johnson GC, Esposito L, Barratt BJ, Smith AN, Heward J, et al. Haplotype tagging for the identification of common disease genes. Nat Genet. 2001;29:233–237. - PubMed
-
- Gabriel SB, Schaffner SF, Nguyen H, Moore JM, Roy J, et al. The structure of haplotype blocks in the human genome. Science. 2002;296:2225–2229. - PubMed
-
- Stram DO, Haiman CA, Hirschhorn JN, Altshuler D, Kolonel LN, et al. Choosing haplotype-tagging SNPS based on unphased genotype data using a preliminary sample of unrelated subjects with an example from the Multiethnic Cohort Study. Hum Hered. 2003;55:27–36. - PubMed
-
- Ke X, Cardon LR. Efficient selective screening of haplotype tag SNPs. Bioinformatics. 2003;19:287–288. - PubMed
Publication types
MeSH terms
LinkOut - more resources
Full Text Sources
