

Highly variable rates of genome rearrangements between hemiascomycetous yeast lineages
- PMID: 16532063
- PMCID: PMC1391921
- DOI: 10.1371/journal.pgen.0020032
Highly variable rates of genome rearrangements between hemiascomycetous yeast lineages
Abstract
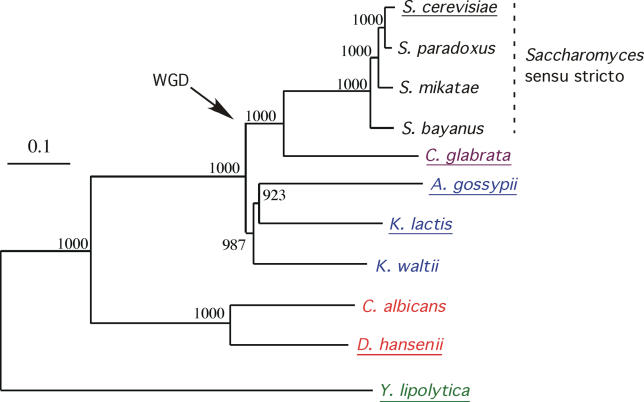
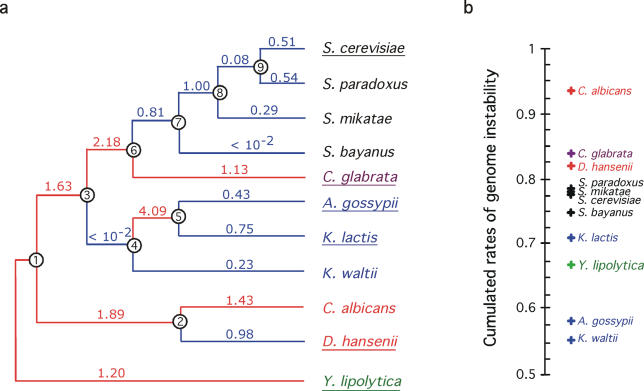
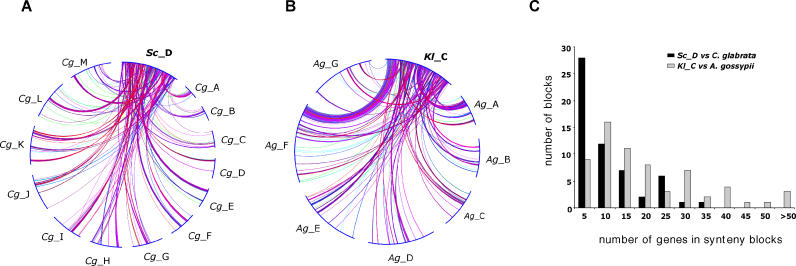
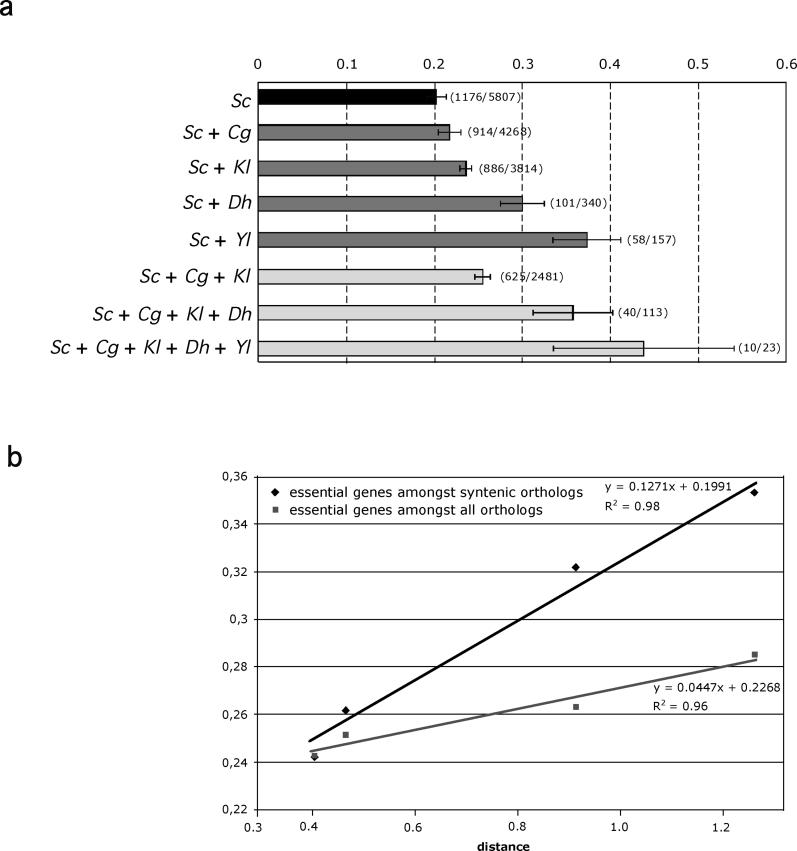
Hemiascomycete yeasts cover an evolutionary span comparable to that of the entire phylum of chordates. Since this group currently contains the largest number of complete genome sequences it presents unique opportunities to understand the evolution of genome organization in eukaryotes. We inferred rates of genome instability on all branches of a phylogenetic tree for 11 species and calculated species-specific rates of genome rearrangements. We characterized all inversion events that occurred within synteny blocks between six representatives of the different lineages. We show that the rates of macro- and microrearrangements of gene order are correlated within individual lineages but are highly variable across different lineages. The most unstable genomes correspond to the pathogenic yeasts Candida albicans and Candida glabrata. Chromosomal maps have been intensively shuffled by numerous interchromosomal rearrangements, even between species that have retained a very high physical fraction of their genomes within small synteny blocks. Despite this intensive reshuffling of gene positions, essential genes, which cluster in low recombination regions in the genome of Saccharomyces cerevisiae, tend to remain syntenic during evolution. This work reveals that the high plasticity of eukaryotic genomes results from rearrangement rates that vary between lineages but also at different evolutionary times of a given lineage.
Conflict of interest statement
Competing interests. The authors have declared that no competing interests exist.
Figures
Similar articles
-
A bunch of fun-guys: the whole-genome view of yeast evolution.Trends Genet. 2005 Jan;21(1):1-3. doi: 10.1016/j.tig.2004.11.006. Trends Genet. 2005. PMID: 15680504
-
Genome structure and dynamics of the yeast pathogen Candida glabrata.FEMS Yeast Res. 2014 Jun;14(4):529-35. doi: 10.1111/1567-1364.12145. Epub 2014 Mar 10. FEMS Yeast Res. 2014. PMID: 24528571 Free PMC article. Review.
-
Genome evolution in yeasts.Nature. 2004 Jul 1;430(6995):35-44. doi: 10.1038/nature02579. Nature. 2004. PMID: 15229592
-
Gene order evolution and paleopolyploidy in hemiascomycete yeasts.Proc Natl Acad Sci U S A. 2002 Jul 9;99(14):9272-7. doi: 10.1073/pnas.142101099. Epub 2002 Jul 1. Proc Natl Acad Sci U S A. 2002. PMID: 12093907 Free PMC article.
-
Evolutionary relationships between Saccharomyces cerevisiae and other fungal species as determined from genome comparisons.Rev Iberoam Micol. 2005 Dec;22(4):217-22. doi: 10.1016/s1130-1406(05)70046-2. Rev Iberoam Micol. 2005. PMID: 16499414 Review.
Cited by
-
Coexpression of linked genes in Mammalian genomes is generally disadvantageous.Mol Biol Evol. 2008 Aug;25(8):1555-65. doi: 10.1093/molbev/msn101. Epub 2008 Apr 24. Mol Biol Evol. 2008. PMID: 18440951 Free PMC article.
-
Computational analysis of the interaction between transcription factors and the predicted secreted proteome of the yeast Kluyveromyces lactis.BMC Bioinformatics. 2009 Jun 25;10:194. doi: 10.1186/1471-2105-10-194. BMC Bioinformatics. 2009. PMID: 19555482 Free PMC article.
-
Additions, losses, and rearrangements on the evolutionary route from a reconstructed ancestor to the modern Saccharomyces cerevisiae genome.PLoS Genet. 2009 May;5(5):e1000485. doi: 10.1371/journal.pgen.1000485. Epub 2009 May 15. PLoS Genet. 2009. PMID: 19436716 Free PMC article.
-
Simultaneous Bayesian gene tree reconstruction and reconciliation analysis.Proc Natl Acad Sci U S A. 2009 Apr 7;106(14):5714-9. doi: 10.1073/pnas.0806251106. Epub 2009 Mar 19. Proc Natl Acad Sci U S A. 2009. PMID: 19299507 Free PMC article.
-
Gross karyotypic and phenotypic alterations among different progenies of the Candida glabrata CBS138/ATCC2001 reference strain.PLoS One. 2012;7(12):e52218. doi: 10.1371/journal.pone.0052218. Epub 2012 Dec 20. PLoS One. 2012. PMID: 23284942 Free PMC article.
References
Publication types
MeSH terms
LinkOut - more resources
Full Text Sources
Molecular Biology Databases
