. 2006 Mar 21;45(11):3588-97.
doi: 10.1021/bi0525369.

Structural basis for sequential cleavage of fibrinopeptides upon fibrin assembly

Affiliations

Structural basis for sequential cleavage of fibrinopeptides upon fibrin assembly

Igor Pechik et al. Biochemistry. .

Abstract

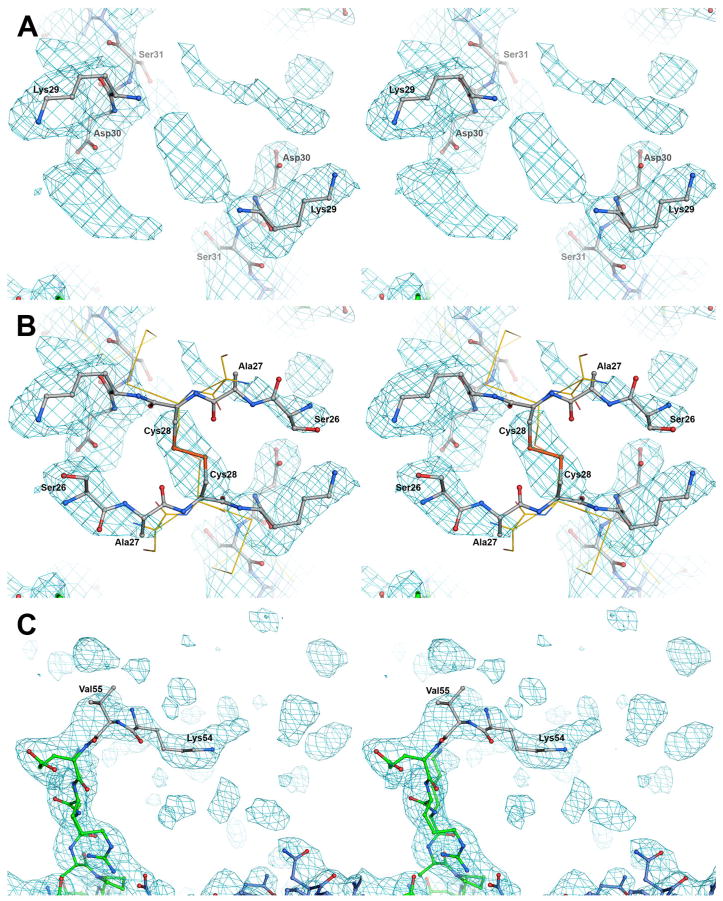
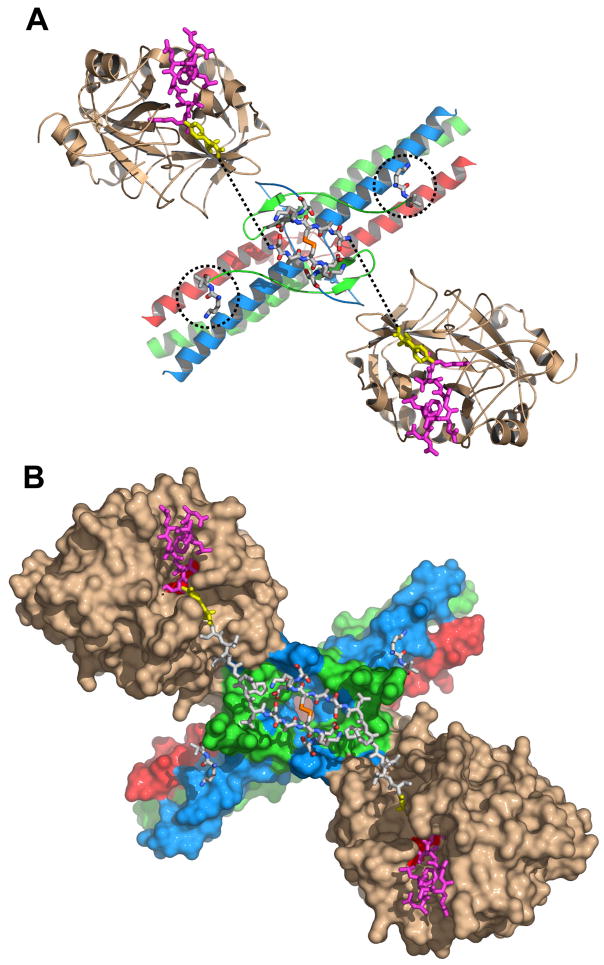
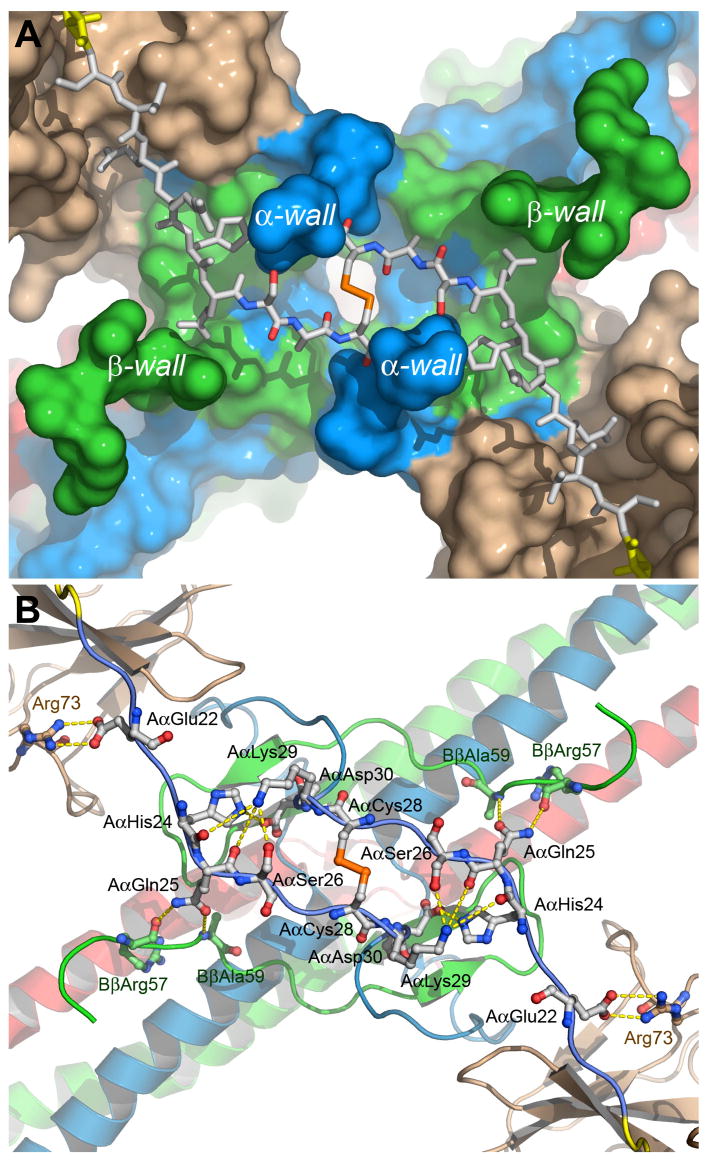
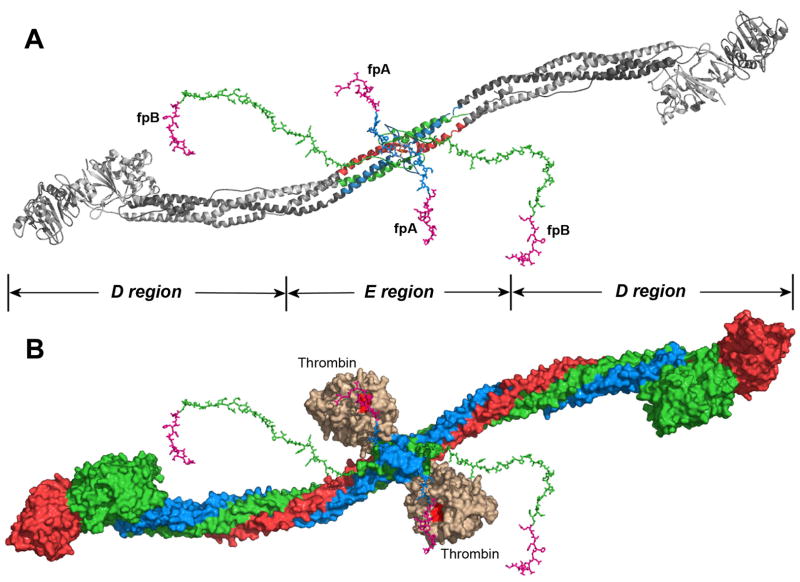
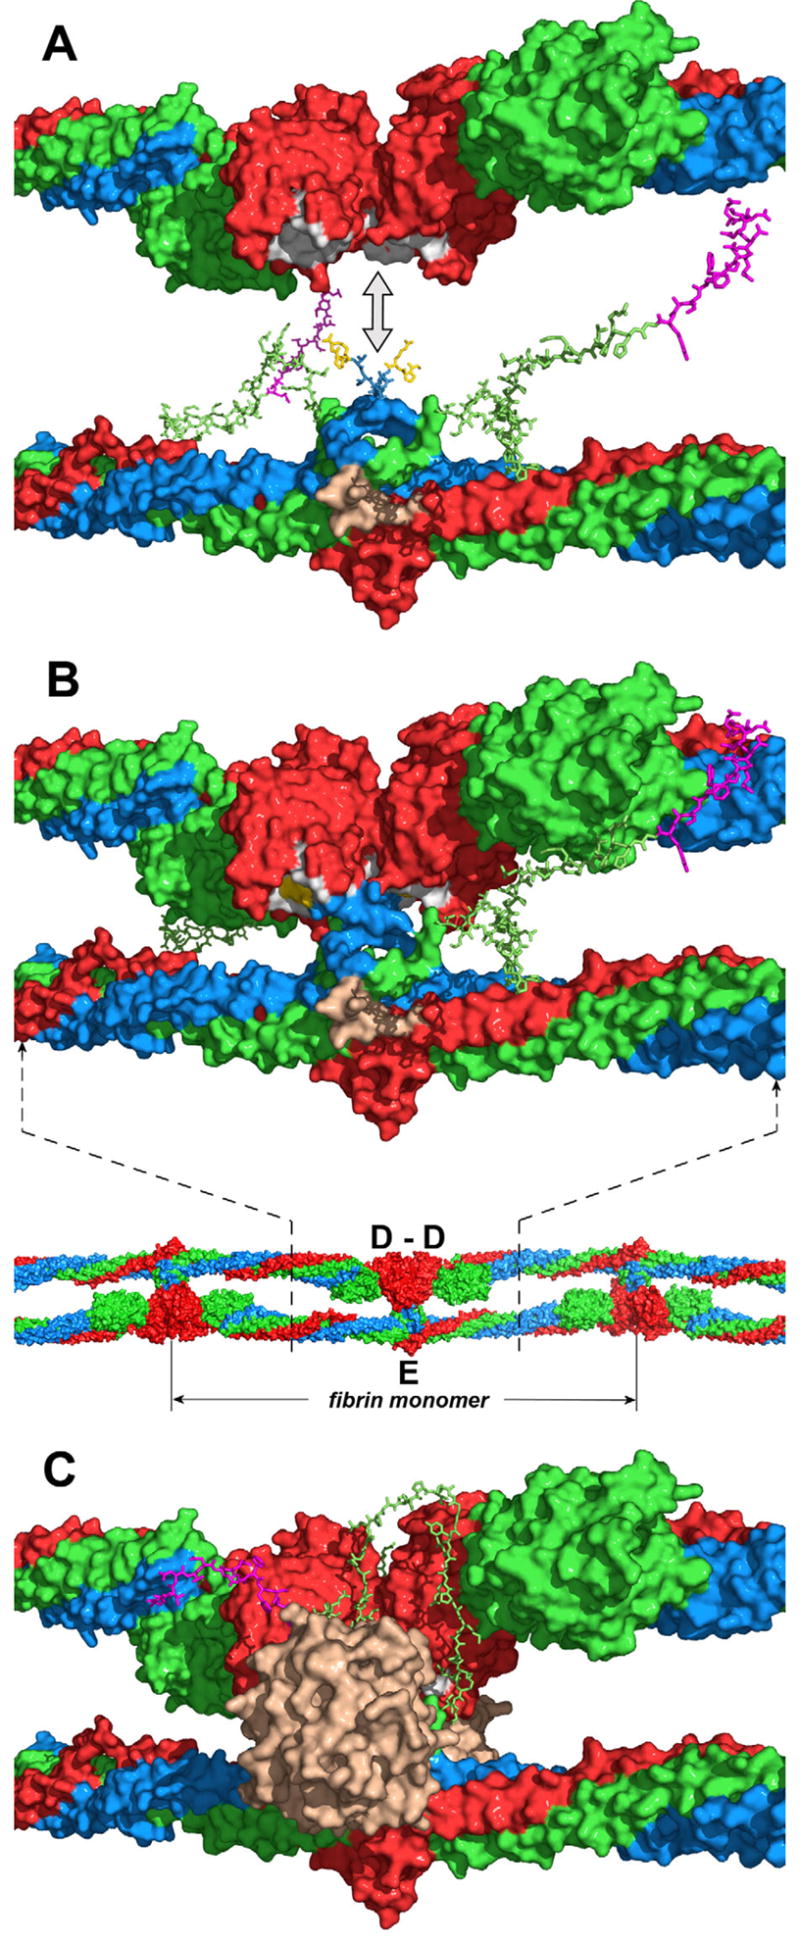
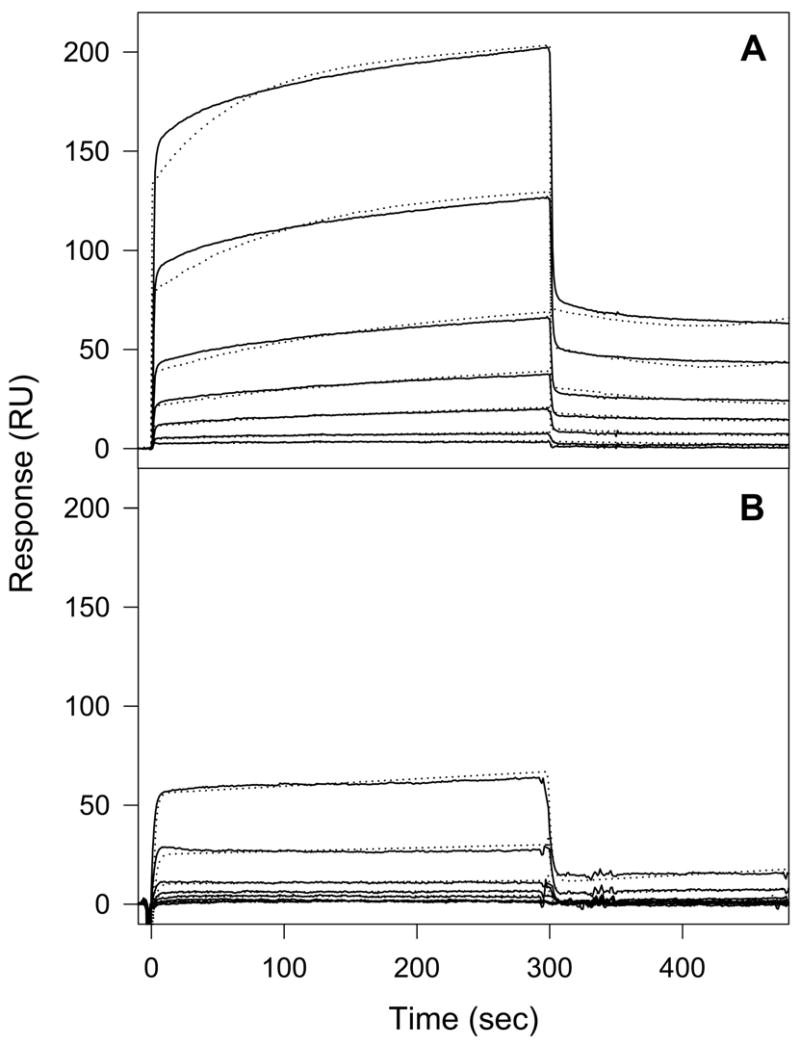
Nonsubstrate interaction of thrombin with fibrinogen promotes sequential cleavage of fibrinopeptides A and B (fpA and fpB, respectively) from the latter, resulting in its conversion into fibrin. The recently established crystal structure of human thrombin in complex with the central part of human fibrin clarified the mechanism of this interaction. Here, we reveal new details of the structure and present the results of molecular modeling of the fpA- and fpB-containing portions of the Aalpha and Bbeta chains, not identified in the complex, in both fibrinogen and protofibrils. The analysis of the results reveals that in fibrinogen the fpA-containing portions are in a more favorable position to bind in the active site cleft of bound thrombin. Surface plasmon resonance experiments establish that the fpB-containing portions interact with the fibrin-derived dimeric D-D fragment, suggesting that in protofibrils they bind to the newly formed DD regions bringing fpB into the vicinity of bound thrombin. These findings provide a coherent rationale for the preferential removal of fpA from fibrinogen at the first stage of fibrin assembly and the accelerated cleavage of fpB from protofibrils and/or fibrils at the second stage.


Figures

Fig. 1
Fig. 1. Stereoview of the annealed composite omit electron density map of the regions surrounding the NH2-terminal portions of the Aα (panels A and B) and Bβ (panel C) chains in the complex of thrombin with the Eht fragment
The map is contoured at 0.8 σ. Panels A and C show the newly built residues; panel B highlight those added through the modeling efforts. Carbon atoms of the newly built and modeled residues are colored in white while those built earlier (16) are in blue for the Aα chains and green for the Bβ chains; nitrogen and oxygen atoms are in blue and red. Panel B shows also the Aα chains of chicken fibrinogen superimposed with the homologous chains of the Eht fragment. Chicken structure (26) is represented by Cα tracing (yellow); the first two identified residues, AαSer27 and AαCys28, are also shown by wireframe model with their side chains.
Fig. 2
Fig. 2. Arrangement of the NH2-terminal portions of the Aα chains in the structure of the complex of thrombin with the Eht fragment
Panel A shows a ribbon diagram of the thrombin-Eht complex with the newly built Aα26-31 and Bβ54-55 residues shown by sticks colored by atom types: blue for nitrogens, red for oxygens, orange for sulfurs, and white for carbons; locations of Bβ54-55 residues are also indicated by the dotted circles. The thrombin-bound fpA variant (28) (PDB entry 1UCY) is shown by magenta (Aα7-16) and yellow (Aα17-19) sticks. Dotted lines indicate the distance between AαArg19 and AαSer26 (see text). Panel B illustrates the solvent accessible surface of the complex with the newly modeled Aα20-25 connecting segments shown by white sticks. In both panels the Aα, Bβ and γ chains of Eht are colored in blue, green and red, respectively; thrombin molecules are in beige.
Fig. 3
Fig. 3. Topology of the molecular surface around the modeled segments of the Aα chains in the thrombin-Eht complex (A) and potential contacts between these segments and the complex (B)
Panel a shows the solvent accessible surface of the thrombin-Eht complex with the Aα20-28 segments (shown by sticks) located in the groove between the wall-like structures denoted as α- and β-walls. The color scheme is the same as in Fig. 2, namely, the Aα, Bβ and γ chains of Eht are in blue, green and red, respectively, thrombin molecules are in beige; the Aα20-25 segments are in white, AαArg19 of the thrombin-bound fpA variant is in yellow, and the Aα26-28 segment are colored by atom types. Panel B shows a ribbon diagram of the thrombin-Eht complex in the same projection as that in panel A with a potential set of polar contacts between individual residues of the Aα22-30 segments and the bulk of the complex. The residues involved in contact formation are represented by ball-and-sticks and colored according to their atom types; interatomic contacts are shown by dashed lines.
Fig. 4
Fig. 4. Putative location of the NH2-terminal portions of the Aα and Bβ chains in fibrinogen
Panels A and B represent the ribbon diagram of fibrinogen and solvent accessible surface of a complex of fibrinogen with thrombin, respectively. The newly modeled portions of the Aα and Bβ chains are presented in both panels by sticks. The model in panel A was generated by superimposing the chicken fibrinogen structure (26), which was used as a template, with that of the Eht fragment (16), followed by replacement of the overlapping regions with those from the latter. In the model, the Aα, Bβ and γ chains derived from Eht are shown in blue, green and red, respectively, those derived from chicken fibrinogen are in gray. The complete NH2-terminal portions of the Aα and Bβ chains including fpA and fpB (both shown in magenta) were modeled as described in the text. Panel B represents the same fibrinogen molecule in complex with two thrombin molecules that were docked to its central region in the way that they appear in the structure of the thrombin-Eht complex (Fig. 2). The complete Aα, Bβ and γ chains are in blue, green and red, respectively. Thrombin molecules are in beige, their catalytic triad is highlighted in red. The vertical lines denote approximate boundaries between the fibrinogen D and E regions.
Fig. 5
Fig. 5. Influence of the E1 fragment and the synthetic peptides mimicking knobs “A” and “B” on the stability of the fibrin-derived D dimer
Solid and dashed curves represent fluorescence-detected melting of the dimeric D-D fragment at 0.16 μM and the D-D:E1 complex at 0.12 μM, respectively. Melting of 0.16 μM D-D in the presence of a 100-fold molar excess of Gly-Pro-Arg-Pro or Gly-Pro-Arg-Pro and Gly-His-Arg-Pro are shown by open and filled circles, respectively, while that in the presence of a 1000-fold excess of Gly-Pro-Arg-Pro is shown by open triangles. All experiments were performed in 50 mM glycine buffer, pH 8.6, with 0.5 mM Ca2+.
Fig. 6
Fig. 6. Putative arrangement of the D and E regions and location of the NH2-terminal portions of the Bβ chains in a protofibril
Panel A represents docking of the D dimer (top diagram) into the E region (bottom diagram) in the direction shown by the double-headed arrow to model the D:E:D interaction in a protofibril presented in panel B (top diagram). The location of the D and E regions in a protofibril is shown in the bottom diagram of panel B by dashed lines; the individual fibrin monomer in the protofibril is also denoted. The D dimer and E region are shown with solvent accessible surfaces; the randomly generated Aα17-23 and Bβ1-53 segments are represented by sticks. The Aα, Bβ and γ chains are shown in blue, green and red, respectively, fpBs in magenta, polymerization knobs “A” of the E region (Aα chain residues Gly17-Pro18-Arg19) in yellow, complementary holes “a” of the D regions in white, and the thrombin-binding site in the E region in beige. Note that although the NH2-terminal portions of the Bβ chains in panel B are shown in the same conformation as in panel A, in a protofibril they should interact with the newly formed D-D “wall” (see text). Panel C shows the same model as panel B with thrombin (in beige) bound to the E region and the NH2-terminal portion of the Bβ chain bound to the D-D “wall”. Although the exact conformation of this portion and the mode of its interaction with D-D are yet to be identified, in the model it is arranged on the D-D “wall” in a way that would facilitate its interaction with the active site cleft of bound thrombin (see text).
Fig. 7
Fig. 7. Analysis of binding of the recombinant (Bβ1-66)2 fragment to the fibrin-derived D dimer (A) and the fibrinogen-derived D1 fragment (B) by surface plasmon resonance
The (Bβ1-66)2 fragment was added at 0.5, 1, 2.5, 5, 10, 25 and 50 μM to the immobilized D dimer (A) or the D1 fragment (B), and its association/dissociation was monitored in real time while registering the resonance signal (response). The dotted curves represent the best fit of the binding data using global fitting analysis (see Experimental Procedures). The determined Kd values are presented in Table 2.

References

    1. Henschen A, McDonagh J. Fibrinogen, fibrin and factor XIII. In: Zwaal RFA, Hemker HC, editors. Blood Coagulation. Elsevier Science Publishers; Amsterdam: 1986. pp. 171–241.
    1. Blomback B. Fibrinogen and fibrin-proteins with complex roles in hemostasis and thrombosis. Thromb Res. 1996;83:1–75. - PubMed
    1. Doolittle RF. Fibrinogen and fibrin. Annu Rev Biochem. 1984;53:195–229. - PubMed
    1. Weisel JW, Medved L. The structure and function of the αC domains of fibrinogen. Ann N Y Acad Sci. 2001;936:312–327. - PubMed
    1. Yang Z, Mochalkin I, Doolittle RF. A model of fibrin formation based on crystal structures of fibrinogen and fibrin fragments complexed with synthetic peptides. Proc Natl Acad Sci USA. 2000;97:14156–14161. - PMC - PubMed

Publication types

Associated data