. 2006 Jan;8(1):18-30.
doi: 10.1593/neo.05544.

Anti-EphA2 antibodies decrease EphA2 protein levels in murine CT26 colorectal and human MDA-231 breast tumors but do not inhibit tumor growth

Affiliations

Anti-EphA2 antibodies decrease EphA2 protein levels in murine CT26 colorectal and human MDA-231 breast tumors but do not inhibit tumor growth

David Kiewlich et al. Neoplasia. 2006 Jan.

Abstract

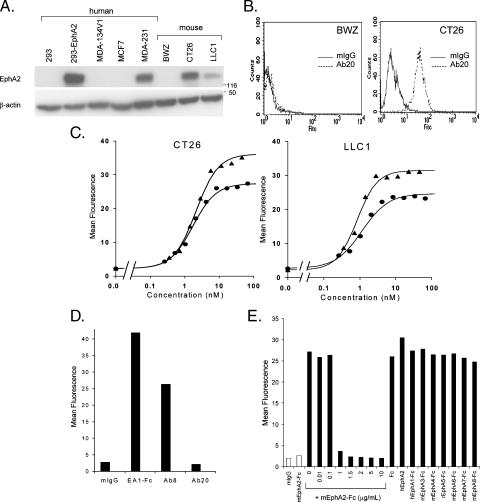
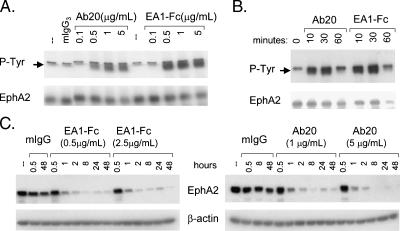
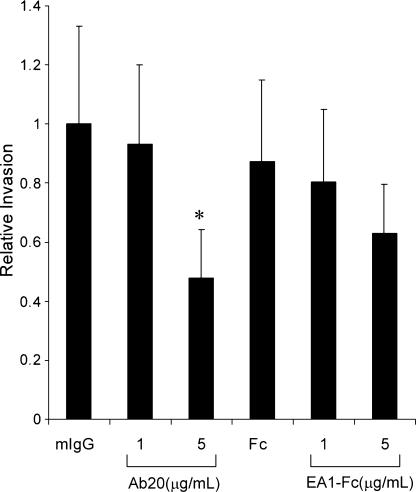
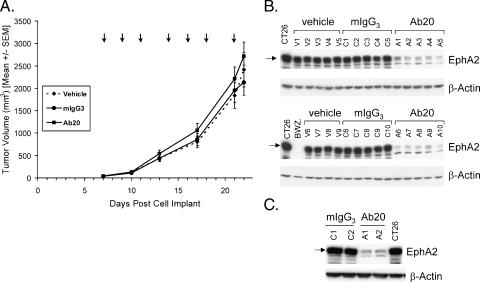
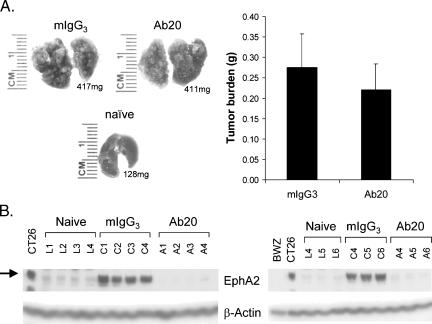
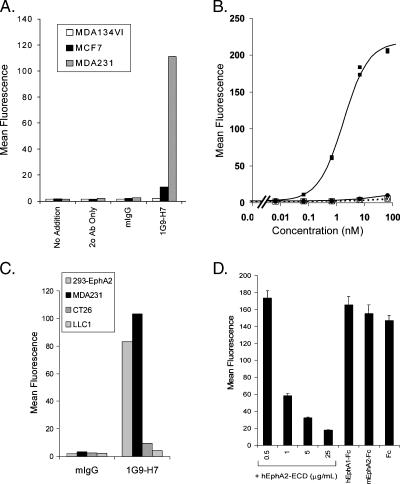
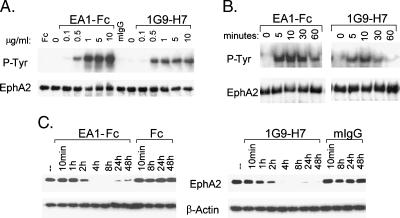
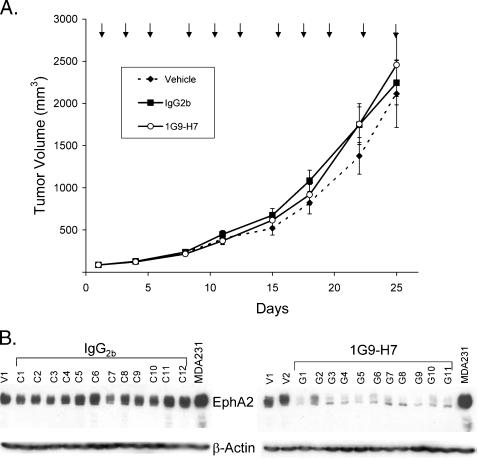
The EphA2 receptor tyrosine kinase has been shown to be over-expressed in cancer and a monoclonal antibody (mAb) that activates and down-modulates EphA2 was reported to inhibit the growth of human breast and lung tumor xenografts in nude mice. Reduction of EphA2 levels by treatment with anti-EphA2 siRNA also inhibited tumor growth, suggesting that the anti-tumor effects of these agents are mediated by decreasing the levels of EphA2. As these studies employed human tumor xenograft models in nude mice with reagents whose cross reactivity with murine EphA2 is unknown, we generated a mAb (Ab20) that preferentially binds, activates, and induces the degradation of murine EphA2. Treatment of established murine CT26 colorectal tumors with Ab20 reduced EphA2 protein levels to approximately 12% of control tumor levels, yet had no effect on tumor growth. CT26 tumor cell colonization of the lung was also not affected by Ab20 administration despite having barely detectable levels of EphA2. We also generated and tested a potent agonistic mAb against human EphA2 (1G9-H7). No inhibition of humanMDA-231 breast tumor xenograft growth was observed despite evidence for >85% reduction of EphA2 protein levels in the tumors. These results suggest that molecular characteristics of the tumors in addition to EphA2 over-expression may be important for predicting responsiveness to EphA2-directed therapies.


Figures

Figure 1
Figure 1
EphA2 expression and FACS binding of Ab20 to cell surface EphA2 in murine and human cells. (A) Western blot analysis of total cell extracts (30 µg protein/lane) from indicated cell lines. EphA2 was detected with the C-20 antibody. Molecular weight standards (kDa) are indicated on the side. (B) CT26 or BWZ cells were incubated with 5 µg/ml mIgG (solid line) or Ab20 (dashed line) for 1 hour at 4°C, labeled with anti-mouse IgG Alexa488, and analyzed by FACS. Histograms of fluorescence intensity (FITC) versus cell number (counts) are shown. (C) CT26 or LLC1 cells were incubated with indicated concentrations of EA1-Fc (triangles) or Ab20 (circles) and treated as described in (B). The mean fluorescence for binding at each concentration is graphically shown. The average EC50 for Ab20 binding (n = 3) to CT26 is 1.94 ± 0.24 nM and to LLC1 is 1.52 ± 0.32 nM. EA 1-Fc EC50 to CT26 is 2.1 nM and to LLC1 is 0.83 nM. (D) Human MDA-231 cell binding of indicated antibodies (5 µg/ml) or EA1-Fc (0.5 µg/ml) was measured as described in (B). (E) CT26 cells were incubated with Ab20 (1 µg/ml) in the presence of indicated concentrations of mEphA2-Fc or other EphA-Fc (10 µg/ml; solid bars). The binding of mIgG (1 µg/ml) or mEphA2-Fc (10 µg/ml) is represented by open bars. Representative data from at least two independent experiments are shown.
Figure 2
Figure 2
Effect of Ab20 on the phosphorylation and degradation of EphA2 in CT26 cells. (A) CT26 cells were incubated with Ab20 or EA1-Fc at 37°C with indicated concentrations for 30 minutes or (B) with 1 µg/ml Ab20 or 0.5 µg/ml EA1-Fc for indicated times. Cell extracts were prepared in RIPA-PP buffer, and 450 µg of protein was immunoprecipitated with anti-EphA2 polyclonal antibody (C-20). Western blots were probed with anti-phosphotyrosine (4G10) andanti-EphA2 (C-20), respectively. Arrows indicate tyrosine-phosphorylated EphA2. (C) CT26 cells were treated with indicated concentrations of EA1-Fc or Ab20 for indicated times, and cell extracts (20 µg/lane) were evaluated by Western blot analysis for EphA2 and β-actin levels. Data shown are representative of at least two independent experiments.
Figure 3
Figure 3
Effect of Ab20 on CT26 tumor cell invasion. CT26 cells (2 x 10⁵) were preincubated with Ab20 or EA1-Fc at RT for 30 minutes and plated onto Matrigel-coated membranes in a modified Boyden chamber. Cell invasion was measured after 19 hours of treatment. Data are the normalized and averaged results from four independent experiments. *Statistically significant atP <.05.
Figure 4
Figure 4
Effect of Ab20 administration on subcutaneous CT26 tumor growth and EphA2 levels. (A) Mice bearing subcutaneous CT26 tumors (50–100 mm3; n = 20/group) were treated with vehicle, mIgG3, or Ab20 (125 µg/dose) according to the schedule shown (arrows). Mean tumor volumes are graphically represented. The corresponding tumor weights (g) were as follows: vehicle, 1.49 ± 0.22; mIgG3, 1.35 ± 0.19; and Ab20, 1.77 ± 0.21. Error bars, SEM. (B) Western blot analysis of extracts (25 µg of protein) from subcutaneous CT26 tumors excised 1 day after the final treatment. EphA2 was detected with anti-EphA2 antibody C-20, and the data for half of the tumors from each group (vehicle, V1–V9; mIgG3, C1–C10; and Ab20, A1–A10) are shown. Similar results were obtained with the remaining tumors. Average (± SD) EphA2 levels determined by densitometric scanning of the blots were as follows: vehicle, 9710 ± 1272; mIgG3, 9674 ± 204; and Ab20, 1413 ± 979 arbitrary units. (C) CT26 tumor lysates from mice treated for 24 hours with mIgG3 (C1 and C2) or Ab20 (A1 and A2) were analyzed as in (B).
Figure 5
Figure 5
Effect of Ab20 treatment on CT26 lung colonization and EphA2 levels. CT26 cells (5 x 10⁵) were injected into the lateral tail vein of BALB/c mice. Three hours before intravenous cell inoculation and every second or third day thereafter, mice (n = 20/group) were treated intraperitoneally with 125 p,g of either Ab20 or isotype-matched control mIgG3. (A) Left side: Photographic images are shown for a representative lung (corresponding weight also indicated) from each treatment group at the end of the study. (A) Right side: Average tumor burden [lung weight of CT26-injected mice minus the average weight of lungs from naïve mice (0.129 ± 0.013 g)] is graphically depicted. Error bars, SEM. (B) EphA2 levels in lung tissue extracts (50 µgprotein/lane) from naïve (L1–L6)-, mIgG3 (C1–C6)-, andAb20 (A1–A6)-treated CT26-bearing mice were analyzed by immunoblotting for EphA2 and β-actin levels.
Figure 6
Figure 6
FACS binding of 1G9-H7 to human EphA2-expressing cells. (A) The indicated human breast cancer cells were incubated in the presence and absence (no addition, secondary Ab only) of 1G9-H7 or normal mouse IgG (2 µg/ml) for 1 hour at 4°C. Primary antibody was detected with anti-mouse IgG Alexa546, and samples were analyzed on a Guava PCA96. The mean fluorescence for each incubation condition is graphically represented. (B) 293 cells (open symbols) and 293-EphA2 cells (solid symbols) were incubated with indicated concentrations of 1G9-H7 (squares) or mIgG (circles), and bound primary antibodies were detected with mouse IgG-Alexa546 by FACS analysis. Mean fluorescence data points for duplicate samples are graphically represented. Calculated EC50 = 1.8 nM. (C) Indicated cells were incubated with 2 µg/ml mIgG or 1G9-H7, and bound primary antibodies were detected with anti-mouse IgG Alexa488 by FACS analysis. (D) MDA-231 cells were incubated with 1G9-H7 (2 µg/ml) and indicated concentrations of hEphA2-ECD or the various soluble EphA receptor proteins at 25 µg/ml at 4°C for 1 hour. Cell-bound 1G9-H7 was detected with anti-mouse IgG Alexa546 by FACS analysis. Error bars, SD. The murine IgG secondary antibody does not bind to human Fc (data not shown). Data shown are representative of at least two independent experiments.
Figure 7
Figure 7
Comparison of EphA2 activation by 1G9-H7 and EA1-Fc. (A) MDA-231 cells were incubated with 1G9-H7 or EA1-Fc at indicated concentrations for 10 minutes at 37°C. EphA2 in total cell lysates was immunoprecipitated and analyzed by Western blot analysis using either anti-phosphotyrosine (P-Tyr) or antiEphA2 (C-20) antibodies. Fc and mIgG were incubated at 10 µg/ml. (B) Western blot analysis of immunoprecipitated extracts prepared at the indicated time points following stimulation of MDA-231 cells with 1 µg/ml EA1-Fc or 1G9-H7. (C) The effect oftreatment forthe indicatedtimes with Fc, EA1-Fc, mIgG, or 1G9-H7 (5 µg/ml) on EphA2 protein levels was evaluated by Western blot analysis using anti-EphA2 (C-20) antibody. Equivalent loading was verified by reprobing the blots with an anti-β-actin antibody. Similar results were observed at 0.5 µg/ml 1G9-H7. Data shown are representative of at least two independent experiments.
Figure 8
Figure 8
Effect of anti-human EphA2 antibody 1G9-H7 on MDA-231 tumor growth. (A) Mice bearing MDA-231 orthotopically implanted tumors (50–200 mm3; n = 12/group) were treated with vehicle, mIgG2b, or 1G9-H7 (125 µg/dose) according to the schedule shown (arrows). Mean tumor weights (g) were as follows: vehicle, 1.94 ± 0.36; IgG2b, 2.45 ± 0.28; and 1G9-H7, 2.72 ± 0.52. Error bars, SEM. (B) Western blot analyses of extracts (30 µg of total protein) from the MDA-231 tumors excised from vehicle (V1 and V2)-, mIgG2b (C1–C12)-, or 1G9-H7 (G1–G11)-treated mice probed with anti-EphA2 (C-20) and anti-β-actin antibodies. Average (± SD) EphA2 levels determined by densitometric scanning of the blots: control, 1535 ± 296; and 1G9-H7, 268 ± 89.

Similar articles

Cited by

References

    1. Kullander K, Klein R. Mechanisms and functions of Eph and ephrin signalling. Nat Rev Mol Cell Biol. 2002;3:475–486. - PubMed
    1. Surawska H, Ma PC, Salgia R. The role of ephrins and Eph receptors in cancer. Cytokine Growth Factor Rev. 2004;15:419–433. - PubMed
    1. Zelinski DP, Zantek ND, Stewart JC, Irizarry AR, Kinch MS. EphA2 overexpression causes tumorigenesis of mammary epithelial cells. Cancer Res. 2001;61:2301–2306. - PubMed
    1. Walker-Daniels J, Coffman K, Azimi M, Rhim JS, Bostwick DG, Snyder P, Kerns BJ, Waters DJ, Kinch MS. Overexpression of the EphA2 tyrosine kinase in prostate cancer. Prostate. 1999;41:275–280. - PubMed
    1. Thaker PH, Deavers M, Celestino J, Thornton A, Fletcher MS, Landen CN, Kinch MS, Kiener PA, Sood AK. EphA2 expression is associated with aggressive features in ovarian carcinoma. Clin Cancer Res. 2004;10:5145–5150. - PubMed