. 2006 Apr;8(2):96-108.
doi: 10.1215/15228517-2005-006. Epub 2006 Mar 2.

Expression studies in gliomas and glial cells do not support a tumor suppressor role for LGI1

Affiliations

Expression studies in gliomas and glial cells do not support a tumor suppressor role for LGI1

Tiziana Piepoli et al. Neuro Oncol. 2006 Apr.

Abstract

Disruptions of LGI1 in glioblastoma (GBM) cell lines and LGI1 mutations in families with autosomal dominant epilepsy imply a role for LGI1 in glial cells as well as in neurons. Although we and others could not find LGI1 mutations in malignant gliomas, our initial studies appeared to support the idea that LGI1 is poorly expressed or absent in these tumors. Microarray data suggested that LGI1 could be involved in the control of matrix metalloproteinases, and we found that tumors derived from U87 glioblastoma cells overexpressing LGI1 were less aggressive than U87 control tumors. To our surprise, we observed that LGI1 expression after differentiation of murine neural stem cells was robust in neurons but negligible in glial cells, in agreement with immunohistochemistry studies on rodent brain. This observation could suggest that the variable levels of LGI1 expression in gliomas reflect the presence of neurons entrapped within the tumor. To test this hypothesis, we investigated LGI1 expression in parallel with expression of the neuronal marker NEF3 by real-time PCR on 30 malignant gliomas. Results showed a strong, positive correlation between the expression levels of these two genes (P < 0.0001). Thus, our data confirm that LGI1 is involved in cell-matrix interactions but suggest that its expression is not relevant in glial cells, implying that its role as a tumor suppressor in gliomas should be reconsidered.


Figures
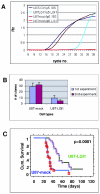
Fig. 1
Fig. 1
In vitro and in vivo effects of LGI1 overexpression in U87 cells. A. Real-time PCR profiles of LGI1 and control (18S) amplification of early-passage U87-LGI1 and U87-mock cells. Level of fluorescence (Rn) detected during PCR was determined by dividing the probe reporter dye signal by the passive reference signal. B. Cloning potential of U87-mock and U87-LGI1 cells after limiting dilution. C. Survival of CD1 nude mice after intracranial injection of U87-LGI1 and U87-mock cells. The Kaplan-Meier analysis combines results of three independent experiments.
Fig. 2
Fig. 2
LGI1 expression is involved in the control of TIMP-3 and MMP-3 expression. The four panels show results of RT-PCR on two independent cDNA samples showing increased expression of TIMP-3 and decreased expression of MMP-3 in U87-LGI1 cells.
Fig. 3
Fig. 3
LGI1 expression is associated with decreased migration of U87 cells. A. A 48-h coculture of U87-mock cells stained with DiL and a fetal brain cell aggregate. An extensive invasion of the normal brain tissue is seen. B. A 48-h coculture of U87-LGI1 cells stained with DiO. A well-defined border is seen between the normal brain tissue and the tumor cells (200×). Inserts in panels A and B: Confocal sections 80 μm inside the cocultures indicating solid infiltration of U87-mock cells (both panel insets: DiL staining, 150×). C. U87-mock migration and U87-LGI1 migration were evaluated in the absence (open bar) or in the presence (diagonal bar) of PDGF (20 ng/ml) as an attractant factor. The results are expressed as number of migrated cells and are the mean values ± SD of a representative experiment, which was performed six times with similar results. *P < 0.01; **P < 0.001 compared to U87-mock cells.
Fig. 4
Fig. 4
LGI1 expression during neural cell differentiation. Murine embryonic stem cells (stage 1) were differentiated subsequently into pan-neural stages (stages 3 and 4) and glial stages (stages 5–8) (for details, see Materials and Methods). The highest LGI1 expression was found in stages with high content of neuronal cells, as indicated by high Tubb3 levels, whereas it was significantly downregulated in later, predominantly glial stages with high GFAP content.
Fig. 5
Fig. 5
Patterns of LGI1 expression in postnatal mouse brain. A. P8 and P14 GFAP-GFP transgenic mice were used for acute isolation and separation of GFP-positive and GFP-negative cells. Flow cytometric analysis (FITC channel) shows GFP distribution in unsorted, GFP-positively sorted, and GFP-negatively sorted cells. B. LGI1 expression levels were highest in the GFP-negative cortical and striatal cell fractions of P14 and P8 mice. These levels were at least twofold increased as compared to the corresponding GFP-positively sorted glial cells. C. Comparison of the Tubb3 (neuronal) and GFAP (glial) expression in GFP-positive and GFP-negative cell fractions.
Fig. 6
Fig. 6
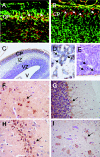
LGI1 expression during brain development and in adult CNS. A. In double-immunofluorescence experiments performed in coronal sections of E15 rat neocortex examined with confocal laser scanner microscopy, postmitotic neurons in the cortical plate express TuJ1 (green) and LGI1 (red) during the migration phase. Overlap in expression of antigens is shown in yellow (84×). B. LGI1-immunoreactive neurons (red, arrows) are interposed within vimentin-positive radial glial fibers (80×). C–E. Immunohistochemistry for LGI1 on E19 neo-cortex coronal sections, counterstained with thionien, shows that LGI1 is expressed predominantly in developing cortical plate, but also in the ventricular zones (6.3×). Higher magnification in panel D (80×) includes the lower part of cortical plate and the upper part of layer VI, showing intense neuronal immunoreactivity for LGI1. Panel E shows the region of the ventricular zone where some LGI1-immunoreactive cells populate the neuroepithelium (40×). (CP, cortical plate; IZ intermediate zone; VZ, ventricular zone; V, third ventricle). F–I. A strong neuronal staining of LGI1 antibodies is visible in the cortex (panel F, 40×), cerebellum (panel G, 40×), hippocampus (panel H, 40×), and anterior horns of the spinal cord (panel I, 60×) of adult murine CNS.
Fig. 7
Fig. 7
Correlation between LGI1 expression and NEF3 expression in malignant gliomas. The graph shows results of the regression analysis on 28 GBMs and two anaplastic astrocytomas. Real-time PCR was performed to assess expression of LGI1 and the neuronal marker NEF3. r = 0.68; P < 0.0001.

References

    1. Albini A, Benelli R, Noonan DM, Brigati C. The “chemoin-vasion assay”: A tool to study tumor and endothelial cell invasion of basement membranes. Int J Dev Biol. 2004;48:563–571. - PubMed
    1. Apte SS, Olsen BR, Murphy G. The gene structure of tissue inhibitor of metalloproteinases (TIMP)-3 and its inhibitory activities define the distinct TIMP gene family (erratum in J. Biol. Chem. [1996] 271, 2874) J Biol Chem. 1995;270:14313–14318. - PubMed
    1. Arato-Ohshima T, Sawa H. Over-expression of cyclin D1 induces glioma invasion by increasing matrix metalloproteinase activity and cell motility. Int J Cancer. 1999;83:387–392. - PubMed
    1. Bachman KE, Herman JG, Corn PG, Merlo A, Costello JF, Cavenee WK, Baylin SB, Graff JR. Methylation-associated silencing of the tissue inhibitor of metalloproteinase-3 gene suggests a suppressor role in kidney, brain, and other human cancers. Cancer Res. 1999;59:798–802. - PubMed
    1. Baker AH, George SJ, Zaltsman AB, Murphy G, Newby AC. Inhibition of invasion and induction of apoptotic cell death of cancer cell lines by overexpression of TIMP-3. Br J Cancer. 1999;79:1347–1355. - PMC - PubMed

Publication types

MeSH terms