. 2006 Mar 20;203(3):633-45.
doi: 10.1084/jem.20051884. Epub 2006 Mar 13.

Roles for HLA and KIR polymorphisms in natural killer cell repertoire selection and modulation of effector function

Affiliations

Roles for HLA and KIR polymorphisms in natural killer cell repertoire selection and modulation of effector function

Makoto Yawata et al. J Exp Med. .

Erratum in

  • J Exp Med. 2006 Apr 17;203(4):1131

Abstract

Interactions between killer cell immunoglobulin-like receptors (KIRs) and human leukocyte antigen (HLA) class I ligands regulate the development and response of human natural killer (NK) cells. Natural selection drove an allele-level group A KIR haplotype and the HLA-C1 ligand to unusually high frequency in the Japanese, who provide a particularly informative population for investigating the mechanisms by which KIR and HLA polymorphism influence NK cell repertoire and function. HLA class I ligands increase the frequencies of NK cells expressing cognate KIR, an effect modified by gene dose, KIR polymorphism, and the presence of other cognate ligand-receptor pairs. The five common Japanese KIR3DLI allotypes have distinguishable inhibitory capacity, frequency of cellular expression, and level of cell surface expression as measured by antibody binding. Although KIR haplotypes encoding 3DL1*001 or 3DL1*005, the strongest inhibitors, have no activating KIR, the dominant haplotype encodes a moderate inhibitor, 3DL1*01502, plus functional forms of the activating receptors 2DL4 and 2DS4. In the population, certain combinations of KIR and HLA class I ligand are overrepresented or underrepresented in women, but not men, and thus influence female fitness and survival. These findings show how KIR-HLA interactions shape the genetic and phenotypic KIR repertoires for both individual humans and the population.


Figures

Figure 1.
Figure 1.
KIR locus variability in the Japanese population. (top) KIR genotype and frequency in a panel of 132 donors. A shaded box indicates the presence of a gene; an unshaded box represents its absence. The deleted form of the 3DP1 pseudogene is indicated by “Δ,” the full-length form is indicated by “F.” The genotype frequencies are compared with previous analysis of 41 donors (reference 22). (bottom) Allele frequencies for the polymorphic genes are listed in order of decreasing frequency. Full-length (10A) and deleted (9A) forms of 2DL4 are designated “F” and “D,” respectively (this is also the case for full-length and deleted forms of 2DS4). KIR2DL2 and 2DL3 are considered alleles, as are 3DL1 and 3DS1. Alleles with novel changes in the coding region are denoted “#.” “⋄” denotes alleles defined by a novel change only in the untranslated region and are given preexisting allele names based on the coding region.
Figure 2.
Figure 2.
Variability of KIR cell surface phenotype in the Japanese population. Each panel shows flow cytometry data obtained from NK cells stained with a different anti-KIR monoclonal antibody: EB6, anti-2DL1 and 2DS1; DX27, anti-2DL2/3 and 2DS2; DX9, anti-3DL1; and DX31, anti-3DL2. The percentage of NK cells that binds antibody (x axis) is plotted against the mean fluorescence intensity (mfi) (y axis), a measure of the amount of antibody bound. Each donor is represented by one data point in each of the four two-dimensional plots. The key gives allele-level genotypes that were subsequently assigned to each person. For donors giving bimodal patterns of DX9 binding, the high and low peaks are represented separately.
Figure 3.
Figure 3.
Allelic polymorphisms of KIR3DL genes determine different levels of cell surface expression. (A) The central panel shows flow cytometric analysis of NK cells stained with the DX9 antibody. The x and y axes are the same as in Fig. 2. Each large data point represents a single person; however, the high and low peaks in donors with bimodal DX9 binding patterns are each represented independently with small data points. 3DL1/3DS1 heterozygotes are represented as one small data point. The 3DL1 genotypes are represented by different symbols; ▪: 3DL1*001 × 1, formula image
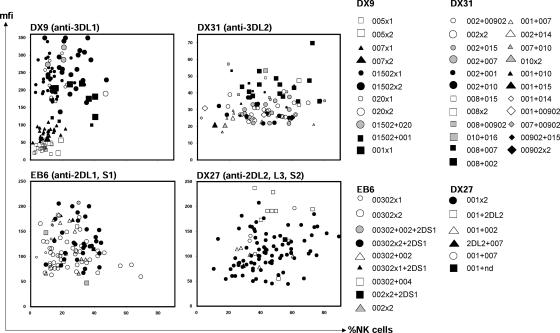
: *001+*01502, Δ: *01502+*020, □: *005 × 1, formula image: *005 × 2, ▴: *007 × 1, formula image: *007 × 2, •: *01502 × 1, formula image: *01502 × 2, ◯: *020 × 1, formula image
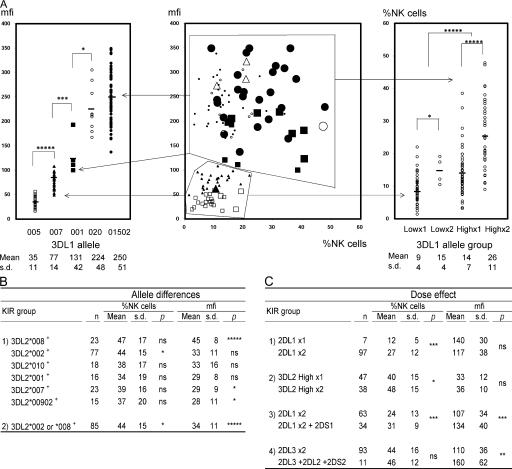
: *020 × 2. The staining as a result of the “low-binding allotypes” (3DL1*005 and *007) is distinguished from that of the “high-binding allotypes” (3DL1*001, *01502, and *020) by the gates. The left panel is a one-dimensional plot of mfi showing how each of the five 3DL1 allotypes corresponds to a different range and mean value of DX9 binding. The right panel is a one-dimensional plot of percentage of NK cells binding DX9 in which the panel members were divided into four groups according to 3DL1 genotype: one low-binding allotype, two low-binding allotypes, one high-binding allotype, and two high-binding allotypes. The frequency of NK cells expressing 3DL1 increases with gene dose. (B) Correlations between flow cytometric analysis (%NK cells and mfi) with DX31 and the different 3DL2 allotypes. Pairwise comparisons were made between phenotypes with and without each 3DL2 allotype in “1),” or with and without the allotype group comprising 3DL2*002 and *008 in “2).” (C) The effects of gene dose on %NK cells and mfi observed with EB6, DX31, and DX27. Pairwise comparisons were made in phenotypes between the two donor groups that differed in gene content as indicated from “1)” to “4).” One copy of a gene is shown by x1, two copies are shown by x2. *, P < 0.05; **, P < 0.01; ***, P < 0.005; and *****, P < 0.0005.
Figure 4.
Figure 4.
The influence of cognate HLA class I on KIR expression by NK cells. (A) Influence of ligand on the frequency of cognate KIR expression. (left) For individuals who have two copies of 2DL1 and no 2DS1, the percent of NK cells expressing 2DL1 is compared between those who lack the C2 ligand (C1/1 genotype) and those who have one copy of it (C1/2 genotype). (right) For individuals who have two high-expressing 3DL1 allotypes, the percent of NK cells expressing 3DL1 is compared between those who lack the Bw4 ligand (Bw6/6 genotype) and those who have one copy of it (Bw4/6 genotype). (B) Influence of ligand on the antibody binding to cognate KIR. (left) For individuals who have two copies of 2DL1 and no 2DS1, the mean binding of anti-2DL1 to 2DL1-expressing NK cells is compared between those who have no C2 ligand, one C2 ligand, and two C2 ligands (C2/2 genotype). (right) For individuals who have one high-expressing 3DL1 allotype, the mean binding of anti-3DL1 to NK cells expressing 3DL1 is compared between those who have no Bw4 ligand, one Bw4 ligand, and two Bw4 ligands. (C) Influence of other ligand–receptor pairs on KIR expression. (top four panels) In each panel, the frequency of cells expressing 3DL1 is compared in four groups of individuals: those who lack Bw4 and are homozygous for C1 (Bw6/6+C1/1); those who are heterozygous for Bw4 and homozygous for C1 (Bw4/6+C1/1); those who are homozygous for Bw4 and C1 (Bw4/4+C1/1); and those who are either heterozygous or homozygous for Bw4 and have two or more other self-ligands for inhibitory KIR (Bw4 + ≥2 ligands). Each of the four panels corresponds to individuals with different 3DL1 genotypes: two high-expressing allotypes (far left), one high and one low-expressing allotype (center, left), one high-expressing allotype and 3DS1 (center, right), and two low-expressing allotypes (far right). Black triangles below each panel indicate increasing number of KIR ligands. (bottom) In each panel, the frequency of cells expressing 2DL2/3 and 2DS2 is compared in three groups of individuals: those who are homozygous for C1 (C1/1);, those who are homozygous for C1 and have one additional self-ligand for inhibitory KIR (C1/1 + 1 ligand); and those who are either homozygous for C1 and have two or more additional self-ligands for inhibitory KIR or are heterozygous for C1/C2 and have one or more additional self-ligands for inhibitory KIR (C1 + ≥2_ligands). The four panels correspond to the same groups based upon KIR3DL1/S1 genotype as the top panels. *, P < 0.05; **, P < 0.01; ***, P < 0.005; and ****, P < 0.001.
Figure 5.
Figure 5.
KIR3DL1 allotypes have different inhibitory capacity. PBMCs from heterozygous donors expressing one high- and one low-expressing 3DL1 allotype were cultured with class I–deficient 721.221 cells or 221 cells transfected with HLA-B*5801, a 3DL1 ligand. The production of IFN-γ by CD33DL1+ cells (3DL1+NK cells) was determined by flow cytometry. Cells expressing the high and the low expressing allotypes formed distinct distributions and were analyzed separately. For each 3DL1 allotype, the number of cells producing IFN-γ in response to 221 and 221-B*5801 was compared and the inhibition mediated by B*5801 was calculated as the percentage of CD33DL1+ NK cells (top) or total NK cells (bottom), as defined by CD3CD56+ PBMC in the KIR phenotype analysis of the donor panel. The number of donors tested for each allotype is shown in parenthesis below the allotype name. Significance values for pairwise comparisons are: *01502/*005: P < 0.02; *01502/*007: P < 0.005; *005/*007: P < 0.003; *020/*005: P < 0.03. Error bars represent the standard deviation of the results obtained with the number of donors shown (bottom).
Figure 6.
Figure 6.
KIR haplotypes have been subject to balancing selection and positive directional selection. (A) Deduced allele-level KIR haplotypes. Shown are the 20 most common haplotypes, their frequencies, and their assignment to group A or B. These haplotypes were all identified by independent analytical methods: the EM-algorithm and the Bayesian phasing method. Independent analysis of three families confirmed the segregation of haplotypes 1, 2, 3, 5, 7, 13, and 15 (not depicted). (B) The Ewens-Watterson homozygosity statistic (F) was used to assess the departure from neutrality of the KIR allele frequencies in 116 Japanese donors. The thick line shows the neutral expectation. F values that are higher than the neutral expectation indicate purifying or directional selection; those that are lower than neutral expectation indicate balancing selection. The thin line shows the limit at maximum balancing selection. The 2DS4, 3DL1, 2DL4, and 3DL2 genes from the telomeric part of the KIR locus appear subject to balancing selection (**, P < 0.01 and #, P < 0.1). 2DL1 and 2DL3 genes in the centromeric part of the KIR locus show a trend toward purifying or directional selection. (C) Tajima's D statistic was applied to a composite of 182 group A coding-region haplotypes using a sliding window. The positions of the individual KIR in the composite are shown along the bottom of the panel. Positive values are indicative of balancing selection, negative values of purifying or directional selection. *, P < 0.05; ****, P < 0.001; and #, P < 0.1. Beneath the panel the results are shown for the Ewens-Watterson test on the centromeric and telomeric parts of the 182 group A haplotypes. Significance was assessed by Watterson's exact test. For both parts, the observed homozygosity was higher than expected. (D) The 182 group A haplotypes are all variants of five basic forms, which can be defined by the five KIR3DL1 alleles. For each of these five subgroups, the haplotype homozygosity is shown. The subgroups are as follows: •: 3DL1*01502, ▴: 3DL1*005, Δ: 3DL1*007, □: 3DL1*001, ◯: 3DL1*020. For each haplotype subgroup, there is a central region of high LD encompassing the 2DL4, 3DL1, and 2DS4 genes, which is flanked by regionsof reduced LD.
Figure 7.
Figure 7.
Non-random KIR-HLA combinations in females. The observed frequencies of KIR-HLA combinations in the Japanese panel were compared with the frequencies predicted by random combination. This revealed a small number of deviations, which were then found to be present in females (top), but not males (bottom). Combinations with strong over-representation are shown in bold. As well as the p-value obtained from the chi-square test, relative risk (rr) was also calculated as a measure of deviation and is shown with 95% confidence intervals (ci).
Figure 8.
Figure 8.
Non-random KIR-HLA associations involve highly inhibitory KIR haplotypes. Although the centromeric part of the KIR locus lacks variability in the Japanese, the “core” region encompassing the 2DL4, 3DL1, and 2DS4 genes has six distinctive motifs (designated by Roman numerals I–VI) at significant frequency, each having a different 3DL1 allele or 3DS1. For 2DL4 and 2DS4, the full-length functional forms are denoted by “F” and the deleted, nonfunctional forms are indicated by “D.” Under “Non-random associations,” the overrepresented combinations of KIR with HLA described in Fig. 7 are indicated by “+,” the underrepresented combinations are indicated by “−.” The overrepresented combinations involve core haplotypes IV and VI that have no activating receptor and the most inhibitory 3DL1 allotypes. nd, not detected.

References

    1. Sun, P.D. 2003. Structure and function of natural-killer-cell receptors. Immunol. Res. 27:539–548. - PubMed
    1. Abi-Rached, L., and P. Parham. 2005. Natural selection drives recurrent formation of activating killer cell immunoglobulin-like receptor and Ly49 from inhibitory homologues. J. Exp. Med. 201:1319–1332. - PMC - PubMed
    1. Parham, P. 2005. MHC class I molecules and KIRs in human history, health and survival. Nat. Rev. Immunol. 5:201–214. - PubMed
    1. Tanamachi, D.M., D.C. Moniot, D. Cado, S.D. Liu, J.K. Hsia, and D.H. Raulet. 2004. Genomic Ly49A transgenes: basis of variegated Ly49A gene expression and identification of a critical regulatory element. J. Immunol. 172:1074–1082. - PubMed
    1. Held, W., B. Kunz, V. Ioannidis, and B. Lowin-Kropf. 1999. Mono-allelic Ly49 NK cell receptor expression. Semin. Immunol. 11:349–355. - PubMed

Publication types

MeSH terms