. 2006 Mar 20;203(3):529-39.
doi: 10.1084/jem.20052116. Epub 2006 Mar 13.

Constraints on HIV-1 evolution and immunodominance revealed in monozygotic adult twins infected with the same virus

Affiliations

Constraints on HIV-1 evolution and immunodominance revealed in monozygotic adult twins infected with the same virus

Rika Draenert et al. J Exp Med. .

Abstract

The predictability of virus-host interactions and disease progression in rapidly evolving human viral infections has been difficult to assess because of host and genetic viral diversity. Here we examined adaptive HIV-specific cellular and humoral immune responses and viral evolution in adult monozygotic twins simultaneously infected with the same virus. CD4 T cell counts and viral loads followed similar trajectories over three years of follow up. The initial CD8 T cell response targeted 17 epitopes, 15 of which were identical in each twin, including two immunodominant responses. By 36 months after infection, 14 of 15 initial responses were still detectable in both, whereas all new responses were subdominant and remained so. Of four responses that declined in both twins, three demonstrated mutations at the same residue. In addition, the evolving antibody responses cross-neutralized the other twin's virus, with similar changes in the pattern of evolution in the envelope gene. These results reveal considerable concordance of adaptive cellular and humoral immune responses and HIV evolution in the same genetic environment, suggesting constraints on mutational pathways to HIV immune escape.


Figures

Figure 1.
Figure 1.
The three siblings shared the same infecting virus and had similar clinical evolution. (A) Maximum likelihood tree reconstructed from HIV-1 pol sequences (corresponding to protease and first 235 amino acids of reverse transcriptase) in the three brothers' viruses over the study period compared with other contemporary viral isolates of treatment-naive subjects in the same city (open circles) and the reference strain HXB2 (closed circle), used as outgroup. The HKY85 with gamma distribution (HKY+I+G) model was used, which accounts for a transition/transversion bias, variable base frequency data, and variable substitution rates at different nucleotide positions. Scale bar represents 1% genetic distance (0.01 substitutions/site). Bootstrap values are shown at nodes with >70% support. (B) Plasma viremia and CD4 cell counts over time for all three siblings.
Figure 2.
Figure 2.
Similar distribution and magnitude of antigen-specific T cell responses in both twins early after infection. IFN-γ T cell responses in TW1 and TW2 at the first available time point (6 mo) after infection expressed as SFCs per million PBMCs. The x axis represents all 410 overlapping peptides spanning all HIV proteins. Each bar represents one response. Stars indicate responses not shared by the twins.
Figure 3.
Figure 3.
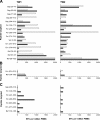
T cell responses during the course of the study. Left panels correspond to TW1 and right panels correspond to TW2. Open bars show the responses at 6 mo after infection and closed bars show the responses at 34 mo after infection. Responses targeted by both twins at the first study time point (A), responses targeted by only one of the twins at the first study time point (B), and new responses arising during the disease course in one or both of the twins (C). Details on epitope sequences can be found in Tables S1–S3 (available at http://www.jem.org/cgi/content/full/jem.20052116/DC1).
Figure 4.
Figure 4.
Comparison of the magnitude of T cell responses between twins. Each square represents one T cell response. The x axis represents the magnitude of the response for TW1, and the y axis represents the magnitude of the response for TW2. (A) The responses at 6 mo after infection. (B) The same analysis at 34 mo after infection. Identical initial responses are as shown as closed squares and different responses or responses coming up later in the disease course are shown as open squares.
Figure 5.
Figure 5.
Concordant and discordant antigen-specific T cell responses and viral evolution in both twins. Concordant (A–C) and discordant (D–F) CD8 T cell responses and viral evolution. (A) Magnitude of the CD8 T cell response toward the B*4001-restricted epitope Pol IL9 in TW1 and TW2 over the study period. (B) Sequence data of the autologous virus of TW1 and TW2 for this epitope at designated time points. Sequences are shown as bulk sequences. The Q→E substitution at position 6 corresponds to the same nucleotide change, CAA→GAA. Lowercase underlined letters indicate the dominant amino acid in population-based sequences showing mixtures of nucleotides. (C) Peptide titration assays using the wild-type peptide and the mutated peptide as antigen in Elispot assay. Frozen PBMCs were used as effectors. (D) Magnitude of the CD8 T cell response toward the epitope IETVPVKL in TW1 and TW2 over the study period. (E) Sequence data of the autologous virus of TW1 and TW2 for this epitope at designated time points. Sequences are shown as bulk sequences. Lowercase underlined letters indicate the dominant amino acid in population-based sequences showing mixtures of nucleotides. In addition, clonal data are shown for TW2 at 34 mo. (F) Peptide titration assays using the wild-type peptide and the mutated peptides as antigen in Elispot assay. Frozen PBMCs were used as effectors.
Figure 6.
Figure 6.
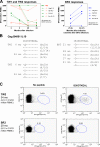
Comparative antigen-specific T cell responses and viral evolution between the twins and their brother. (A) Magnitude of the B*4001-restricted CD8 T cell responses over time. (left) Solid line, TW1; dotted line, TW2; (right) BR3. (B) Bulk and clonal sequence data of the autologous virus in all three brothers at designated time points for the Gag B4001 IL10 epitope. Lowercase underlined letters indicate the dominant amino acid in population-based sequences showing mixtures of nucleotides. (C) Intracellular cytokine staining using in vitro–grown, peptide-stimulated CD8 T cell lines and a synthetic peptide as antigen. For TW2, the CD8 line was grown from frozen PBMCs at month 34. For BR3, the CD8 line was grown from frozen PBMCs at month 29 (16 mo after infection). The magnitude of the ex vivo Gag B4001 IL10 response was 0 SFCs/million PBMCs for both at the mentioned time point.
Figure 7.
Figure 7.
Antibody-neutralizing titers of TW1, TW2, and BR3 plasma against autologous and heterologous viruses. The autologous neutralizing antibody responses are displayed for TW1 (A), TW2 (B), and BR3 (C). The heterologous neutralizing antibody responses are displayed for TW1 plasma samples against TW2 viruses (D), for TW2 plasma samples against TW1 viruses (E), and for BR3 plasma against TW2 viruses (F). Antibody-neutralizing titers of BR3 plasma against TW1 viruses were similar to TW2 viruses. All time points refer to the twins infection; BR3 was infected with the twins' virus ∼13 mo later. (C) Open circles indicate samples that were available only for BR3.
Figure 8.
Figure 8.
Accumulation of amino acid substitutions drives diversification of envelope to allow escape from neutralizing antibodies. Nonsynonymous (dN) and synonymous (dS) divergence from baseline virus (in percent) over time, averaged over the whole envelope sequence. Numbers in brackets refer to the estimated time of infection of BR3.

Comment in

References

    1. Gaschen, B., J. Taylor, K. Yusim, B. Foley, F. Gao, D. Lang, V. Novitsky, B. Haynes, B.H. Hahn, T. Bhattacharya, and B. Korber. 2002. Diversity considerations in HIV-1 vaccine selection. Science. 296:2354–2360. - PubMed
    1. Preston, B.D., B.J. Poiesz, and L.A. Loeb. 1988. Fidelity of HIV-1 reverse transcriptase. Science. 242:1168–1171. - PubMed
    1. Wei, X., S.K. Ghosh, M.E. Taylor, V.A. Johnson, E.A. Emini, P. Deutsch, J.D. Lifson, S. Bonhoeffer, M.A. Nowak, B.H. Hahn, et al. 1995. Viral dynamics in human immunodeficiency virus type 1 infection. Nature. 373:117–122. - PubMed
    1. Ho, D.D., A.U. Neumann, A.S. Perelson, W. Chen, J.M. Leonard, and M. Markowitz. 1995. Rapid turnover of plasma virions and CD4 lymphocytes in HIV-1 infection. Nature. 373:123–126. - PubMed
    1. Coffin, J.M. 1995. HIV population dynamics in vivo: implications for genetic variation, pathogenesis, and therapy. Science. 267:483–489. - PubMed

Publication types

MeSH terms