Comparative Study
. 2006 Apr;16(4):451-65.
doi: 10.1101/gr.4143406. Epub 2006 Mar 13.

Ancient duplicated conserved noncoding elements in vertebrates: a genomic and functional analysis

Affiliations
Comparative Study

Ancient duplicated conserved noncoding elements in vertebrates: a genomic and functional analysis

Gayle K McEwen et al. Genome Res. 2006 Apr.

Abstract

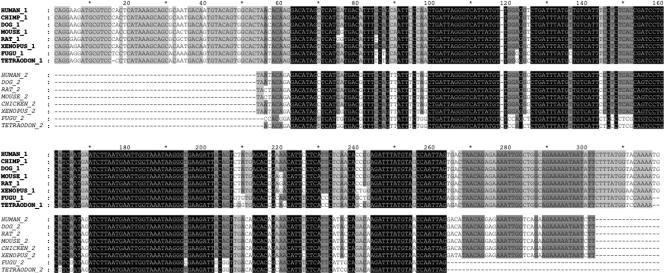
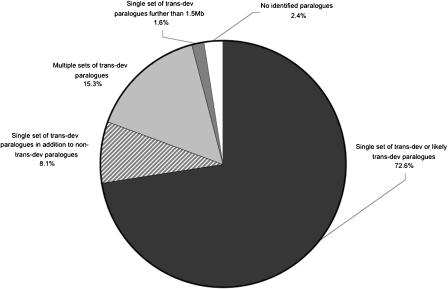
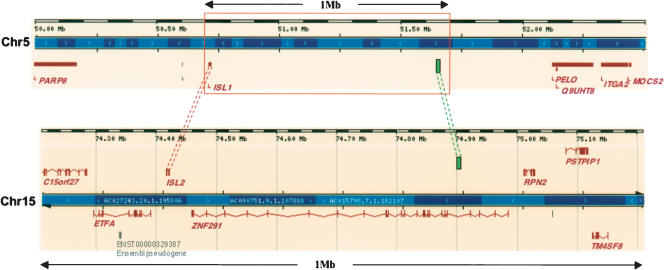
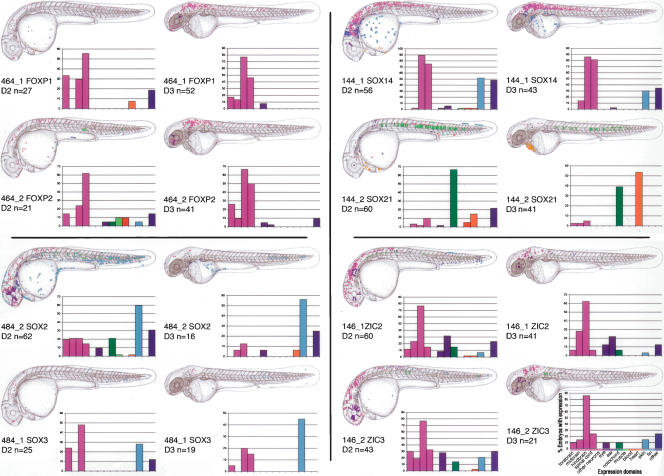
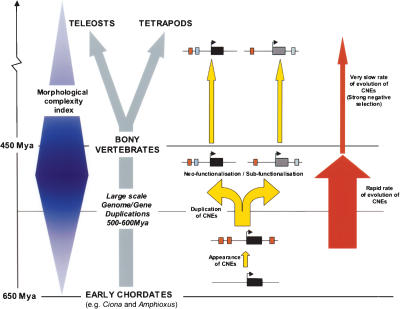
Fish-mammal genomic comparisons have proved powerful in identifying conserved noncoding elements likely to be cis-regulatory in nature, and the majority of those tested in vivo have been shown to act as tissue-specific enhancers associated with genes involved in transcriptional regulation of development. Although most of these elements share little sequence identity to each other, a small number are remarkably similar and appear to be the product of duplication events. Here, we searched for duplicated conserved noncoding elements in the human genome, using comparisons with Fugu to select putative cis-regulatory sequences. We identified 124 families of duplicated elements, each containing between two and five members, that are highly conserved within and between vertebrate genomes. In 74% of cases, we were able to assign a specific set of paralogous genes with annotation relating to transcriptional regulation and/or development to each family, thus removing much of the ambiguity in identifying associated genes. We find that duplicate elements have the potential to up-regulate reporter gene expression in a tissue-specific manner and that expression domains often overlap, but are not necessarily identical, between family members. Over two thirds of the families are conserved in duplicate in fish and appear to predate the large-scale duplication events thought to have occurred at the origin of vertebrates. We propose a model whereby gene duplication and the evolution of cis-regulatory elements can be considered in the context of increased morphological diversity and the emergence of the modern vertebrate body plan.


Figures

Figure 1.
Figure 1.
A two-member dCNE family (#464) located within the introns of FOXP1 (464_1) and FOXP2 (464_2). Multiple alignment of sequences was carried out using CLUSTALW (v1.83) (Thompson et al. 1994). Element boundaries were defined by sequence conservation between human and Fugu for each family member. Human–Fugu orthologs of 464_1 are conserved at 92.7% identity over 316 bases while orthologs of 464_2 are conserved at 88.4% identity over 199 bases between these species. Conservation between human copies of 464_1 and 464_2 across the length of the smaller element (248 bp) was 83.5%, lower than that seen between orthologous copies but considerably higher than the average conservation between human dCNEs (Fig. 5). In addition, these elements have a length ratio (see Methods) of 0.78 indicating significant evolution of the elements at their edges. 464_1 was not detected in chicken and 464_2 was not detected in chimp, possibly because of missing sequence in these assemblies.
Figure 2.
Figure 2.
Presence of trans-dev paralogs in the vicinity of the 124 dCNE families. For the majority of families, trans-dev paralogs were detected within 1.5 Mb, either upstream or downstream of dCNEs. In most cases, just a single set of paralogs was detected with annotation relating to trans-dev (black), with some regions containing additional non trans-dev paralogs (striped). Some regions contained multiple sets of trans-dev paralogs (light gray). For dCNEs located in gene deserts, a search region up to the next known gene was used (dark gray). A small proportion of dCNEs were located in regions with no functionally annotated paralogs (white).
Figure 3.
Figure 3.
dCNE families with more than two members. Brown lines connect dCNEs within the same family. (A) An unusual three-member family is found around SALL1 and SALL3. Here, two of the members are found both 5′ and 3′ of SALL1, a feature not seen in any of the other families. (B) A three-member family of interest is located around EVX1 and EVX2. Here, the two members on Chr7 show significant similarity to different parts of the single element on Chr2 and are separated by a gap of 665 bp, little of which is conserved across orthologous regions in other vertebrates. The same region is only 150 bp on Chr2 and is conserved across vertebrates, indicating that this is likely to be the ancestral element. (C) dCNEs around NEUROD 1, 2, and 6 are retained in a similar manner to those in E although this set of paralogs contains no two-member families. (D) In contrast to dCNEs retained across three-member paralogous gene families as in C and E, PAX2, PAX5, and PAX8 retain only two-member dCNE families, connected by a central gene (PAX2). Blue boxes within the red dashed box represent dCNE located within the introns of these genes. (E) Four three-member families (yellow boxes) are located around three teashirt orthologs on human chromosomes 18, 19, and 20 that possess overlapping expression domains (Caubit et al. 2005). Additionally, seven two-member families (blue boxes) are retained between different pairs of these paralogs. Element lengths are represented relative to a 100-bp element shown in the key. Gene annotation was taken from Ensembl v27.35.1 for SDCCAG33 and ZNF537 and the Vertebrate Genome Annotation Database (http://vega.sanger.ac.uk/Homo_sapiens) for ZNF218. Distance of dCNEs from the presumed translation start site (TSS) in all three genes is fixed according to the lower scale. Different scales are used for the distance downstream of the TSS for ZNF218 (lower scale) and SDCCAG33 and ZNF537 (upper scale).
Figure 4.
Figure 4.
Location of dCNEs in the vicinity of homeobox paralogs ISL1 (Chr5) and ISL2 (Chr15). ISL1 and ISL2 are the only paralogs within 1.5 Mb of the dCNEs (represented by green boxes) present in both regions (full extent not shown). The dCNE on Chr5 is located within a ‘gene desert’ and is ∼926 Kb 3′ of the ISL1 translation start site. In a similar manner to 27 other dCNE families (Supplemental Table S2), one dCNE is located within the intron of a gene (in this case ZNF291) while the other is located in a large intergenic region (spanning 1.39 Mb between ISL1 and PELO). In isolation, we would normally presume the dCNE on Chr15 to be associated with ZNF291, the closest trans-dev gene. However, as ZNF291 has no paralogs in the human genome, the ISL paralogs are far more likely to be the true associated genes of the dCNEs. In addition, this dCNE family has undergone an inversion event so that one dCNE is located in the same orientation to the target gene in one instance and the opposite orientation to the target gene in the other. Diagram adapted from the Ensembl Genome Browser (Hubbard et al. 2005).
Figure 5.
Figure 5.
Mean percent sequence identities of related dCNEs within and between species. “Between species” represents orthologous dCNEs; dCNEs from two-member families are extremely well conserved between human and chicken copies (Human1–Chick1, Human2–Chick2) with a lower level of conservation between human and Fugu copies (Human1–Fugu1, Human2–Fugu2), reflecting the longer phylogenetic branch length and higher rate of evolution in fish genomes (Jaillon et al. 2004). Error bars represent the standard error of the mean. “Within species” represents dCNEs within the same genome; mean conservation is much lower between dCNEs within the same species than between orthologs, indicating an increased rate of evolution following duplication followed by extreme evolutionary constraint sometime prior to the fish–tetrapod divergence. For >80% of families that contained at least two members in Fugu, phylogenetic trees constructed using maximum parsimony (with 1000 bootstrap replicates) fitted the expected topology, i.e., dCNE family members were more similar between genomes than within genomes.
Figure 6.
Figure 6.
dCNEs direct GFP reporter gene expression in specific tissues. For each dCNE, cumulative GFP expression data is pooled from a number of embryos (n ≥ 20 expressing embryos per dCNE on day 2 of development). Embryos are examined for GFP expression at ∼26–30 hpf and 50–54 hpf and schematically overlaid on camera lucida drawings of 2- and 3-day-old zebrafish embryos. Different cell types are color-coded, and the same key is used for all panels. Both the color code and the key are displayed under the day 3 chart for dCNE 146_2. Graphs encompass the same data set as the schematics and display the percentage of GFP-expressing embryos that show expression in each tissue category for a given dCNE. The total number of expressing embryos analyzed per CNE is displayed just below the schematic in each case. FOXP1/FOXP2 dCNEs 461_1 and 461_2 did not up-regulate GFP expression in this assay.
Figure 7.
Figure 7.
Up-regulation of GFP expression by dCNEs. GFP expression is shown in live embryos as fluorescent images (A,B,C) or in fixed tissue following whole-mount anti-GFP immunostaining (D–H). All embryos are 48–54 hpf. Lateral views, anterior to the left, dorsal to the top. GFP expression is shown in the following tissue or cell types, indicated by arrowheads: (A) 464_1, FOXP1; hindbrain; (B) 464_2, FOXP2; hindbrain; (C) dCNE 144_1, SOX14; hindbrain; (D) 144_2, SOX21; heart; (E) 484_2, SOX2; epidermal cells; (F) 484_1, SOX3; epidermal cells; (G) 146_1, ZIC2; lens and various neurons in the fore-, mid-, and hindbrain; (H) 146_2, ZIC3; retina and various neurons in the fore- and hindbrain. Scale bar 50 μm (A–D,G,H) or 100 μm (E,F). (e) Eye; (f) fin; (fb) forebrain; (h) heart; (hb) hindbrain; (l) lens; (mb) midbrain; (ov) otic vesicle; (r), retina; (s) somite; (y) yolk.
Figure 8.
Figure 8.
Proposed model of CNE evolution in the context of other major genomic events during the early vertebrate radiation. Modern bony vertebrates evolved from the chordate lineage between 650 and 450 Mya, during a period of rapid morphological change (represented here in blue and based on the Morphological Complexity Index as described in Aburomia et al. 2003). It is now generally accepted that during this period an early ancestral vertebrate underwent one, or possibly two, whole-genome duplications, generating a greatly increased repertoire of genes, which in turn may have contributed to this increase in morphological complexity. The appearance of CNEs in vertebrate genomes (red boxes adjacent to gene loci, depicted as dark boxes) can be dated prior to these large-scale duplication events, as most of the dCNEs are associated with trans-dev paralogs that derive from these ancient duplications (yellow arrows). The duplication of gene loci together with associated cis-regulatory modules generates the plasticity for genes to develop new functions (neofunctionalization) and/or to perform a subset of the functions of the parent gene (subfunctionalization). This evolution must have occurred rapidly following duplication over a relatively short evolutionary period (∼50–150 Myr) during which time dCNEs evolved in length and sequence. In contrast, in the period since the teleost–tetrapod divergence (∼450 Mya), dCNEs have had a remarkably slow mutation rate and have remained practically unchanged.

Similar articles

Cited by

References

    1. Aburomia R., Khaner O., Sidow A., Khaner O., Sidow A., Sidow A. Functional evolution in the ancestral lineage of vertebrates or when genomic complexity was wagging its morphological tail. J. Struct. Funct. Genomics. 2003;3:45–52. - PubMed
    1. Altschul S.F., Madden T.L., Schaffer A.A., Zhang J., Zhang Z., Miller W., Lipman D.J., Madden T.L., Schaffer A.A., Zhang J., Zhang Z., Miller W., Lipman D.J., Schaffer A.A., Zhang J., Zhang Z., Miller W., Lipman D.J., Zhang J., Zhang Z., Miller W., Lipman D.J., Zhang Z., Miller W., Lipman D.J., Miller W., Lipman D.J., Lipman D.J. Gapped BLAST and PSI-BLAST: A new generation of protein database search programs. Nucleic Acids Res. 1997;25:3389–3402. - PMC - PubMed
    1. Aparicio S., Chapman J., Stupka E., Putnam N., Chia J.M., Dehal P., Christoffels A., Rash S., Hoon S., Smit A., Chapman J., Stupka E., Putnam N., Chia J.M., Dehal P., Christoffels A., Rash S., Hoon S., Smit A., Stupka E., Putnam N., Chia J.M., Dehal P., Christoffels A., Rash S., Hoon S., Smit A., Putnam N., Chia J.M., Dehal P., Christoffels A., Rash S., Hoon S., Smit A., Chia J.M., Dehal P., Christoffels A., Rash S., Hoon S., Smit A., Dehal P., Christoffels A., Rash S., Hoon S., Smit A., Christoffels A., Rash S., Hoon S., Smit A., Rash S., Hoon S., Smit A., Hoon S., Smit A., Smit A., et al. Whole-genome shotgun assembly and analysis of the genome of Fugu rubripes. Science. 2002;297:1301–1310. - PubMed
    1. Arnone M.I., Davidson E.H., Davidson E.H. The hardwiring of development: Organization and function of genomic regulatory systems. Development. 1997;124:1851–1864. - PubMed
    1. Barton L.M., Gottgens B., Gering M., Gilbert J.G., Grafham D., Rogers J., Bentley D., Patient R., Green A.R., Gottgens B., Gering M., Gilbert J.G., Grafham D., Rogers J., Bentley D., Patient R., Green A.R., Gering M., Gilbert J.G., Grafham D., Rogers J., Bentley D., Patient R., Green A.R., Gilbert J.G., Grafham D., Rogers J., Bentley D., Patient R., Green A.R., Grafham D., Rogers J., Bentley D., Patient R., Green A.R., Rogers J., Bentley D., Patient R., Green A.R., Bentley D., Patient R., Green A.R., Patient R., Green A.R., Green A.R. Regulation of the stem cell leukemia (SCL) gene: A tale of two fishes. Proc. Natl. Acad. Sci. 2001;98:6747–6752. - PMC - PubMed

Publication types