. 2006 Mar 13;172(6):847-60.
doi: 10.1083/jcb.200506119.

Separase: a universal trigger for sister chromatid disjunction but not chromosome cycle progression

Affiliations

Separase: a universal trigger for sister chromatid disjunction but not chromosome cycle progression

Karin G Wirth et al. J Cell Biol. .

Abstract

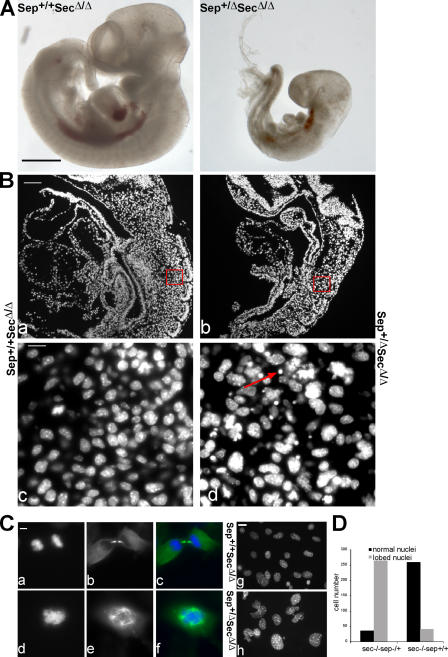
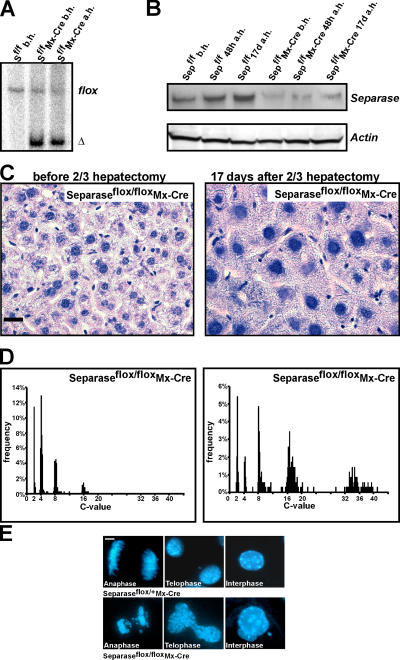
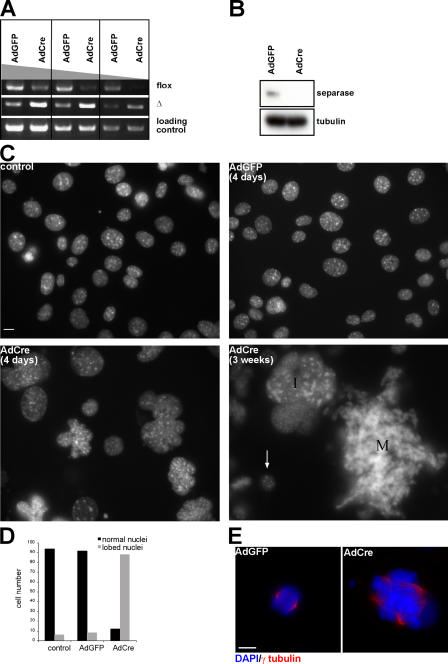
Separase is a protease whose liberation from its inhibitory chaperone Securin triggers sister chromatid disjunction at anaphase onset in yeast by cleaving cohesin's kleisin subunit. We have created conditional knockout alleles of the mouse Separase and Securin genes. Deletion of both copies of Separase but not Securin causes embryonic lethality. Loss of Securin reduces Separase activity because deletion of just one copy of the Separase gene is lethal to embryos lacking Securin. In embryonic fibroblasts, Separase depletion blocks sister chromatid separation but does not prevent other aspects of mitosis, cytokinesis, or chromosome replication. Thus, fibroblasts lacking Separase become highly polyploid. Hepatocytes stimulated to proliferate in vivo by hepatectomy also become unusually large and polyploid in the absence of Separase but are able to regenerate functional livers. Separase depletion in bone marrow causes aplasia and the presumed death of hematopoietic cells other than erythrocytes. Destruction of sister chromatid cohesion by Separase may be a universal feature of mitosis in eukaryotic cells.


Figures

Figure 1.
Figure 1.
Generation of Separase and Securin floxed and Δ alleles. (A) Targeting strategy for Separase. Shown are the Separase genomic locus, the targeting vector, and the targeted allele. Exons are indicated as black boxes, the conserved peptidase domain starting at exon 18 (nucleotide 3980 of the mRNA) as red boxes, and the exon containing the conserved histidine and cysteine as a green box. For Separase the eight COOH-terminal exons were flanked by loxP sites (triangles). The selection cassette Neo-Tk is represented as red and green boxes and the DTA-cassette as a blue box. Cre-mediated recombination (dashed lines) was used to obtain Separase floxed or Δ alleles. (B) Southern blot to confirm germ-line transmission of Separase flox and Δ alleles with EcoRV-digested DNA and the internal probe c1. (C) Targeting strategy for generating Securin floxed and Δ alleles. (D) Southern blot to confirm germ-line transmission of Securin Δ alleles with BamHI-digested DNA using the internal probe c1.
Figure 2.
Figure 2.
SecurinΔ/ΔSeparaseΔ/+ embryos show developmental defects. (A) Securin Δ/+ Separase Δ/+ female mice were crossed with Securin Δ/+ Separase +/+ male mice. At 10.5 dpc, Securin Δ/Δ Separase Δ/+ embryos were obtained at the expected Mendelian ratio. However, Securin Δ/Δ Separase Δ/+ embryos were smaller and less developed than Securin Δ/+ Separase +/+ embryos. Bar, 1 mm. (B) Paraffin longitudinal sections of Securin Δ/+ Separase +/+ (a) and Securin Δ/Δ Separase Δ/+ (b) embryos 9.5 dpc were stained with Hoechst to visualize the nuclei. Squared regions in panels a and b are shown enlarged in panels c and d. Bars: (a and b) 100 μm; (c and d) 10 μm. Arrow points to a dead cell. (C) MEFs from Securin Δ/+ Separase +/+ and Securin Δ/Δ Separase Δ/+ embryos (10.5 dpc) were cultured and analyzed by immunofluorescence microscopy. Cells were stained with DAPI (a, d, g, and h) and α-tubulin (b and e). Bars, 10 μm. (D) Number of lobed nuclei in Securin Δ/+ Separase +/+ and Securin Δ/Δ Separase Δ/+ MEFs.
Figure 3.
Figure 3.
Hepatocytes after two thirds hepatectomy are highly polyploid. (A) Southern blot analysis of Separaseflox/flox and Separaseflox/floxMx-Cre livers before and 17 d after the two thirds hepatectomy. The Separase flox band is efficiently deleted in Separaseflox/floxMx-Cre livers. (B) Western blot from livers before, 48 h after, and 17 d after the two thirds hepatectomy. The Separase protein is detected in Separaseflox/flox hepatocytes, whereas in Separaseflox/floxMx-Cre hepatocytes the Separase protein is down-regulated. b.h., before the two thirds hepatectomy; a.h., after the two thirds hepatectomy. (C) Hematoxylin/ eosin staining of livers from Separaseflox/floxMx-Cre mice before and 17 d after the two thirds hepatectomy. Separaseflox/floxMx-Cre hepatocytes increase in ploidy and in cell size after the two thirds hepatectomy. Bar, 10 μm. (D) Single-cell DNA measurement of Feulgen-stained hepatocyte nuclei demonstrating the increase in DNA content in Separaseflox/floxMx-Cre hepatocytes at 17 d after the two thirds hepatectomy. (E) Hoechst staining of hepatocytes in culture. Compared with Separase flox/+ Mx-Cre hepatocytes, Separaseflox/floxMx-Cre hepatocytes demonstrate anaphases with sister chromatid missegregation, telophases with DNA bridges between daughter cells and multinucleated hepatocytes in interphase. Bar, 1 μm.
Figure 4.
Figure 4.
iMEFs lacking Separase become polyploid with multipolar spindle. (A–E) Separase Δ/flox iMEFs were infected with AdCre and -GFP, respectively. (A) Genomic PCR was performed to reveal the deletion of the last eight exons in the Separase genomic locus 4 d after virus infection. PCR primers were used to amplify the flox and the deletion allele. The region located in the Separase NH2-terminal coding sequence was amplified for loading control. (B) Western blot analysis of Separase protein level in the cells 4 d after viral infection. Tubulin was used as a loading control. (C) Nuclear morphology revealed by DAPI staining. Control represents Separase Δ/flox iMEFs not infected with the virus. iMEFs were infected with AdGFP and -Cre, respectively, and DAPI staining was performed 4 d later. Note that the size of the cells 3 wk after AdCre transduction can be directly compared with small nuclei from cells that were most likely not infected with the virus (arrow). I, interphase cell; M, mitotic cell. (D) Number of lobed nuclei 4 d after viral infection counted in 100 interphase cells. (E) Immunofluorescence staining of the cells 3 d after viral infection. γ-tubulin was used to stain the spindle. Bars, 10 μm.
Figure 5.
Figure 5.
iMEFs lacking Separase reveal higher ordered chromosomes. (A) Schematic overview of viral infection and harvesting procedure. (B) A portion of cells harvested for the analysis in C was methanol fixed, and their DNA content was analyzed by flow cytometry. Arrows indicate peaks showing <2C and >16C that were not present in the cells infected with AdGFP. (C) Chromosome spreads of cells harvested at the different time points. Before harvesting, cells were treated with nocodazole for 5 h to enrich mitotic cells and collected by mitotic shakeoff. (D) Higher magnification of the high-ordered chromosomes resulting from cells infected with AdCre and harvested at different time points. Number of chromatids is indicated. Control cells that underwent the same procedure except that they were not infected had a FACS profile very similar to that of the cells infected with AdGFP (not depicted). Bars, 10 μm.
Figure 6.
Figure 6.
Cytokinesis occurs in some iMEFs lacking Separase. The infection and harvesting procedure was the same as in Fig. 5 A, except that a single time point 24 h after splitting was taken. (A) Immunostaining was performed using anti–Aurora B (red) and anti-MkLp1 (green) antibodies. DNA was stained with DAPI (blue). Prometaphase or metaphase (a), anaphase (b), and telophase (c) are shown. Arrows indicate unequal distribution of the DNA in cells infected with AdCre. (B) Different mitotic stages were scored in cells not infected with any virus (control) and cells infected with AdCre and -GFP, respectively. Mitotic stages were defined according to the Aurora B, MkLp1, and localization. n = 100 per cell type. (C) Immunostaining was performed using anti–cyclin B. DNA was stained with DAPI. (D) Cyclin B–positive and –negative metaphase plates were scored in cells infected with AdCre and -GFP. n = 100 per cell type. Bars, 10 μm.
Figure 7.
Figure 7.
Live cell imaging of cells lacking Separase. (A and B) Separase Δ/flox iMEF cells expressing mRFP-tagged histone H2B were grown to 100% confluency, infected with the virus, and split 48 h later. After 24 h, live cell imaging was performed using a fluorescence microscope. Stacks of six different z plane images were obtained every 10 min, and projected images for several time points are shown. Bars, 50 μm.
Figure 8.
Figure 8.
Cohesin stays on the chromosomes in mitotic cells lacking Separase. A Separase Δ/flox stable cell line expressing Scc1-myc was generated. (A–C) Characterization of the cell line. (A) Silver stain of the IP products from cells expressing Scc1-myc and control cells using an anti-myc antibody. (B) Western blot of the same IP reaction as in A using anti-myc and anti-Smc3 antibodies. E, eluate; S, supernatant; ce, cell extract. (C) Immunostaining using anti-myc antibody (green) and CREST serum (red). Cells were treated with nocodazole for 30 min and spun on glass slides. Note that Scc1-myc staining was observed in the centromeric region between two CREST dots. (D) Cells were infected with the virus as in Fig. 5 A, and 24 h after splitting cells were processed for immunofluorescence microscopy. Mitotic cells were spun on glass slides and analyzed for cohesin with an antibody to the myc epitope and P-H3. (E) Cells positive for myc and P-H3 as well as negative for myc but positive for P-H3 were scored. n = 200 per cell type. (F) Cells were infected in the same way as in D and collected 48 h after splitting. Before harvesting, cells were treated with nocodazole for 30 min to disrupt the spindle, leading to better spreading of chromosomes. Bars, 10 μm.

References

    1. Baum, P., C. Yip, L. Goetsch, and B. Byers. 1988. A yeast gene essential for regulation of spindle pole duplication. Mol. Cell. Biol. 8:5386–5397. - PMC - PubMed
    1. Chestukhin, A., C. Pfeffer, S. Milligan, J.A. DeCaprio, and D. Pellman. 2003. Processing, localization, and requirement of human separase for normal anaphase progression. Proc. Natl. Acad. Sci. USA. 100:4574–4579. - PMC - PubMed
    1. Ciosk, R., W. Zachariae, C. Michaelis, A. Shevchenko, M. Mann, and K. Nasmyth. 1998. An Esp1/Pds1 complex regulates loss of sister chromatid cohesion at the metaphase to anaphase transition in yeast. Cell. 93:1067–1076. - PubMed
    1. Cohen-Fix, O., J.-M. Peters, M.W. Kirschner, and D. Koshland. 1996. Anaphase initiation in Saccharomyces cerevisiae is controlled by the APC-dependent degradation of the anaphase inhibitor Pds1p. Genes Dev. 10:3081–3093. - PubMed
    1. Funabiki, H., K. Kumada, and M. Yanagida. 1996. a. Fission yeast Cut1 and Cut2 are essential for sister chromatid separation, concentrate along the metaphase spindle and form large complexes. EMBO J. 15:6617–6628. - PMC - PubMed

Publication types

MeSH terms