. 2006 Mar-Apr;17(2):538-47.
doi: 10.1021/bc060018k.

Development of contrast agents targeted to macrophage scavenger receptors for MRI of vascular inflammation

Affiliations

Development of contrast agents targeted to macrophage scavenger receptors for MRI of vascular inflammation

Björn Gustafsson et al. Bioconjug Chem. 2006 Mar-Apr.

Abstract

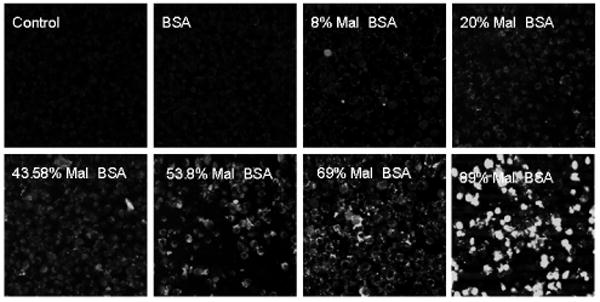
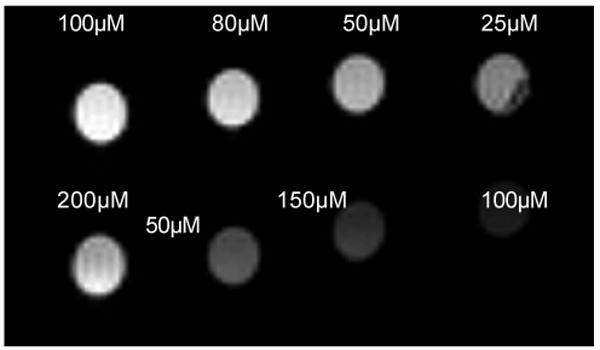
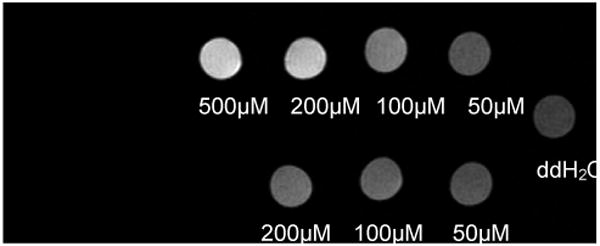
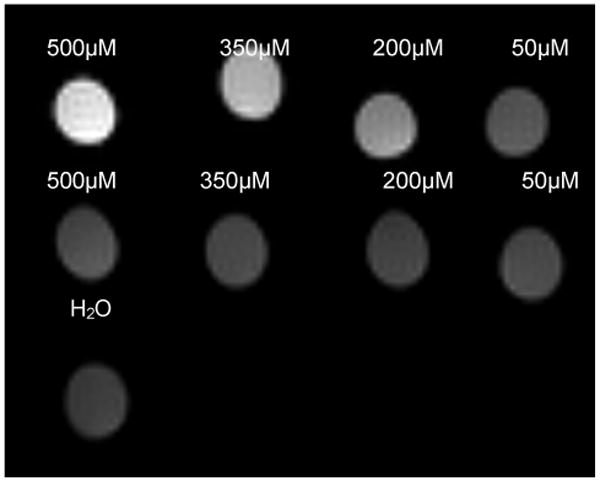
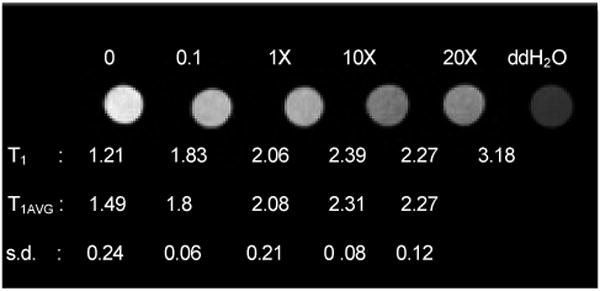
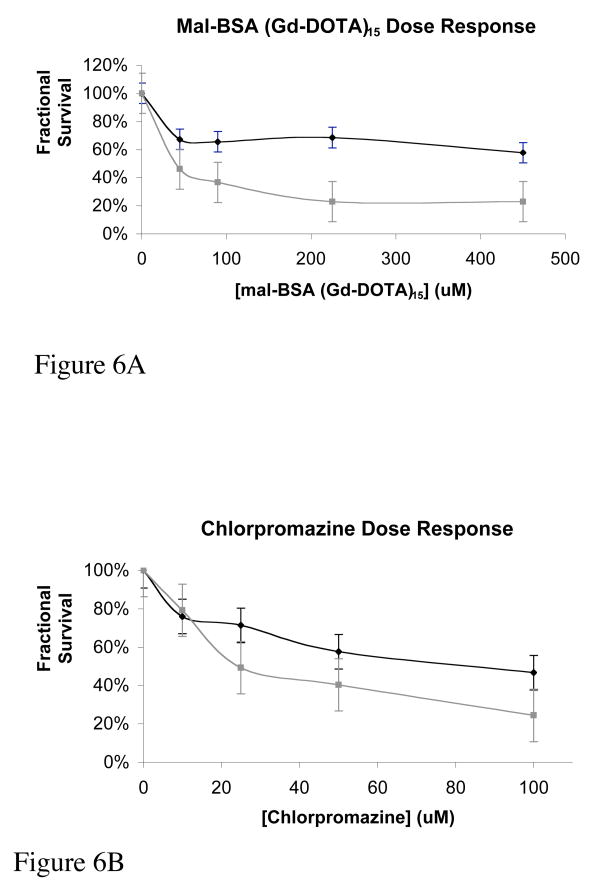
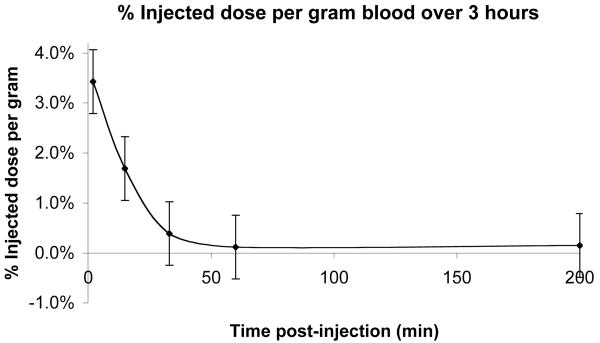
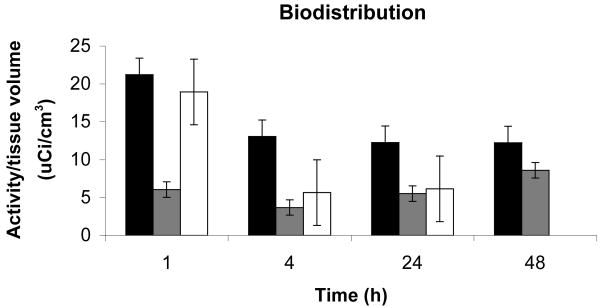
Atherosclerosis is a leading cause of death in the U.S. Because there is a potential to prevent coronary and arterial disease through early diagnosis, there is a need for methods to image arteries in the subclinical stage as well as clinical stage using various noninvasive techniques, including magnetic resonance imaging (MRI). We describe a development of a novel MRI contrast agent targeted to plaques that will allow imaging of lesion formation. The contrast agent is directed to macrophages, one of the earliest components of developing plaques. Macrophages are labeled through the macrophage scavenger receptor A, a macrophage specific cell surface protein, using an MRI contrast agent derived from scavenger receptor ligands. We have synthesized and characterized these contrast agents with a range of relaxivities. In vitro studies show that the targeted contrast agent accumulates in macrophages, and solution studies indicate that micromolar concentrations are sufficient to produce contrast in an MR image. Cell toxicity and initial biodistribution studies indicate low toxicity, no detectable retention in normal blood vessels, and rapid clearance from blood. The promising performance of this contrast agent targeted toward vascular inflammation opens doors to tracking of other inflammatory diseases such as tumor immunotherapy and transplant acceptance using MRI.


Figures

Figure 1
Figure 1
Macrophage uptake is dependent on degree of maleylation. Cells were incubated with FITC labeled derivatives of mal-BSA bearing different numbers of maleyl groups. Signal intensity increases with increasing maleylation, with significant uptake at greater than 50% maleylation. Optimal uptake is observed for 80% maleylation and above.
Figure 2
Figure 2
Contrast enhancement correlates with number of Gd-DOTAs bound. Solutions of mal-BSA (Gd-DOTA)n with n = 10 (bottom row) or 18 (top row) in distilled, deionized water, pH 7.0 were imaged at 7T at ambient temperature (25°C). Signal intensity increases as concentration increases (from right to left) and greater signal intensity is observed for the more heavily labeled agent. Contrast enhancement is observed for concentrations greater than 25-50μM.
Figure 3
Figure 3
Mal-BSA (Gd-DOTA)n is taken up by macrophages. P388D1 cells were incubated with n = 15 (top row) or n = 10 (bottom row) mal-BSA (Gd-DOTA)n for one hour then imaged at 7T. Contrast increases in a concentration dependent manner (right to left) indicating uptake of the contrast agent by the cells. Contrast enhancement is observed for an application of as low as 50μM contrast agent to the cells (top row, rightmost column). Actual T1 values were, left-right: (top row) = 0.84s, 0.96s, 1.49s. 2.33s; (bottom row) = 1.79s, 1.96s, 2.51s; (water) = 3.44s
Figure 4
Figure 4
Uptake of mal-BSA (Gd-DOTA)n is specific. P388D1 cells were incubated with either mal-BSA (Gd-DOTA)n or a matched BSA control, n = 22 for both. Cells were imaged at 7T. Macrophages demonstrate uptake of the maleylated agent (top row) but do not recognize the non-maleylated control (middle row). Contrast enhancement after uptake of mal-BSA (Gd-DOTA)22 is observable for as little as 25μM of the agent applied to cells. Actual T1 values were, left-right: (top row) = 0.58s. 0.89s, 1.46s, 2.53s; (bottom row) = 2.81s, 2.90s, 3.09s, 2.85s; (water) = 3.50s
Figure 5
Figure 5
Uptake of mal-BSA (Gd-DOTA)n is receptor-mediated. P388D1 cells were incubated with a fixed concentration of mal-BSA (Gd-DOTA)15 and increasing molar excesses of unlabeled mal-BSA. Representative samples are shown with molar excesses of competitor as indicated above each sample. Actual T1 values for the image appear below each sample, as well as average and standard deviation T1 for triplicate repeats. All values are given in seconds. Cells were imaged at 7T. Increasing molar excess of unlabeled agent inhibits uptake of the labeled agent and reduced signal in the image. T1 decreases dramatically with molar excess of competitor. Competition by unlabeled ligand confirms that uptake of the contrast agent is receptor-mediated.
Figure 6
Figure 6
Toxicity of mal-BSA. Cytotoxicity was assessed for mal-BSA (Gd-DOTA)15 and chlorpromazine as a positive control. The assays were carried out in parallel and in triplicate. Cells were counted and plated evenly in a 96-well plate. After a 24-hour adhesion time, varying concentrations of mal-BSA (Gd-DOTA)15 (0, 45, 90, 225, and 445μM) or chlorpromazine (0, 10, 25, 50, and 100μM) were placed on the cells. After a 4- and 24-hour agent exposure time at 37°C the MTT assay was performed. Dose response curves at 4- (black) and 24- (gray) hours are shown for mal-BSA (Gd-DOTA)15 (Figure 6A) and chlorpromazine (Figure 6B). For 4h mal-BSA incubation, toxic dose EC50 is not reached for the concentrations of agent tested (EC50 > 450μM). For the 24h mal-BSA EC50 = 40μM. This is in contrast with chlorpromazine with EC50 = 84μM for 4h incubation and EC50 = 24μM for 24h incubation. Toxicity of mal-BSA (Gd-DOTA) is less that that of the chlorpromazine standard. Error bars reflect standard error.
Figure 7
Figure 7
Blood clearance. Blood samples were collected by tail nicking at 2, 15, 33, 60 and 200 minutes post injection of contrast agent and quantitated by gamma counting. Clearance from the blood is rapid with ∼ 97% of the injected agent cleared out from the blood stream after 2 minutes; 0.5% of injected dose remaining after 30 minutes and undetectable levels in the blood after 1 hour. Error bars reflect standard error.
Figure 8
Figure 8
Biodistribution in the rat model. Primary sites of accumulation of the agent in normal tissues are in liver (black), kidneys (gray), and urinary bladder (white). Clearance from kidneys is rapid in first hour. Signal from bladder falls to negligible levels by 48h. Error bars reflect standard error.
Figure 9
Figure 9
Liver pharmacokinetics. The clearance of the agent from the liver is initially rapid. The activity per tissue volume of the agent decreased over 60% the first four hours after injection. Calculated corresponding concentration of the agent falls to 18μM after 4h, well below the EC50 found for macrophages in culture (EC50 > 450μM for 1h, EC50 = 40μM for 24h). Error bars reflect standard error.

Similar articles

Cited by

References

    1. Desai MY, Bluemke DA. Atherosclerosis imaging using MR imaging: current and emerging applications. Magn Reson Imaging Clin N Am. 2005;13:171–80. vii. - PubMed
    1. Rogers WJ, Prichard JW, Hu YL, Olson PR, Benckart DH, Kramer CM, Vido DA, Reichek N. Characterization of signal properties in atherosclerotic plaque components by intravascular MRI. Arterioscler Thromb Vasc Biol. 2000;20:1824–30. - PubMed
    1. Fayad ZA. MR imaging for the noninvasive assessment of atherothrombotic plaques. Magn Reson Imaging Clin N Am. 2003;11:101–13. - PubMed
    1. Choudhury RP, Fuster V, Fayad ZA. Molecular, cellular and functional imaging of atherothrombosis. Nat Rev Drug Discov. 2004;3:913–25. - PubMed
    1. Ruygrok P, Webster M, deValk V, vanEs G, Ormiston J, Morel M, Serruys P. Clinical and angiographic factors associated with asymptomatic restenosis after percutaneous coronary intervention. Circulation. 2001;104:2289. - PubMed

Publication types