. 2006 Mar 21;103(12):4592-7.
doi: 10.1073/pnas.0508685103. Epub 2006 Mar 10.

Prevention of cytotoxic T lymphocyte responses to factor IX-expressing hepatocytes by gene transfer-induced regulatory T cells

Affiliations

Prevention of cytotoxic T lymphocyte responses to factor IX-expressing hepatocytes by gene transfer-induced regulatory T cells

Eric Dobrzynski et al. Proc Natl Acad Sci U S A. .

Abstract

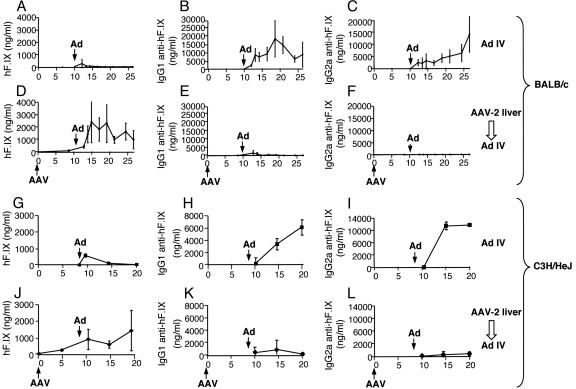
Treatment of genetic disease such as the bleeding disorder hemophilia B [deficiency in blood coagulation factor IX (F.IX)] by gene replacement therapy is hampered by the risk of immune responses to the therapeutic gene product and to the gene transfer vector. Immune competent mice of two different strains were tolerized to human F.IX by hepatic gene transfer mediated by adenoassociated viral vector. These animals were subsequently challenged by systemic administration of an E1/E3-deleted adenoviral vector, which is known to induce a cytotoxic T lymphocyte response to the transgene product. Immune tolerance prevented cytotoxic T lymphocyte activation to F.IX and CD8(+) cellular infiltrates in the liver. Moreover, a sustained and substantial increase in hepatic F.IX expression from the adenoviral vector was achieved despite in vitro T cell responses to adenoviral antigens. Cytolytic responses to therapeutic and to viral vector-derived antigens had been prevented in vivo by activation of regulatory CD4(+) T cells, which mediated suppression of inflammatory lymphocyte responses to the liver. This result suggests that augmentation of regulatory T cell activation should provide new means to avoid destructive immune responses in gene transfer.


Conflict of interest statement

Conflict of interest statement: No conflicts declared.

Figures

Fig. 1.
Fig. 1.
Plasma levels of hF.IX (A, D, G, and J), IgG1 (B, E, H, and K), and IgG2a (C, F, I, and L) anti-hF.IX in BALB/c (AF) or C3H/HeJ (GL) mice as a function of time. All mice (n = 4 per group) received i.v. injection of Ad-hF.IX at week 10 (marked “Ad”; 4 × 10¹⁰ particles per mouse). Mice were naïve at this time point (AC and GI) or had previously received hepatic AAV-hF.IX gene transfer (marked “AAV”) at day 0 (1 × 10¹¹ vg per mouse; DF and JL).
Fig. 2.
Fig. 2.
Liver sections of C3H/HeJ (AD) and BALB/c (EH) mice 2 weeks (AD and GJ) or 3–4 months (E, F, K, and L) after i.v. infusion of Ad-hF.IX (4 × 10¹⁰ particles per mouse). Mice were naïve at the time of adenoviral gene transfer (A, C, E, G, I, and K) or had received hepatic AAV-hF.IX gene transfer 10 weeks earlier (B, D, F, H, J, and L). Immunostaining for hF.IX (red) and CD8 (green) is shown in A, B, EH, K, and L. Hematoxylin and eosin staining is shown in C, D, I, and J. (Original magnification: ×100.)
Fig. 3.
Fig. 3.
In vitro CTL assay for hF.IX-specific (A) or adenovirus-specific (B) cytolytic activity of splenocytes isolated from C3H/HeJ mice that were naïve at the time of adenoviral gene transfer (squares in A) or had received hepatic AAV-hF.IX gene transfer 10 weeks earlier (circles in A and diamonds in B). Splenocytes were isolated 10 days after adenoviral gene transfer. C3H-derived fibroblasts expressing hF.IX (filled symbols in A) or no additional antigen (open symbols in A and B) or that had been infected with Ad-LacZ vector (filled squares in B) were used as targets. Data in A represent average results ± SD of three independent experiments (each involving splenocytes pooled from three animals per experimental group). B is the result of a single experiment using pooled splenocytes from three animals. Each effector:target ratio for each pool of effector cells was assayed in quadruplicate.
Fig. 4.
Fig. 4.
Antigen requirements for tolerance induction. C3H/HeJ mice received hepatic gene transfer with AAV vector-expressing hF.IX or LacZ transgenes (1 × 10¹¹ vg per mouse, first vector) followed by i.v. injection of Ad-hF.IX or Ad-LacZ vector (4 × 10¹⁰ particles per mouse, second vector) 6 weeks later. Levels of systemic hF.IX (A) and anti-hF.IX (B) were measured 1 month after the second gene transfer.
Fig. 5.
Fig. 5.
Adoptive transfer of CD4+ and CD4-depleted splenocytes from hepatic AAV-hF.IX-transduced (hatched bars in graphs) or naïve control (open bars) C3H/HeJ mice. (A) Experimental outline. Six weeks after hepatic AAV-hF.IX gene transfer, cells were transferred by tail vein injection into naïve mice of the same strain. Control groups were given splenocytes from naïve mice. After 36 h, all animals received tail vein injection of Ad-hF.IX vector (4 × 10¹⁰ particles per mouse; n = 4 per experimental group). Systemic hF.IX levels were measured 1 month (B) and 2 months (C) after adenoviral gene transfer. D depicts anti-hF.IX levels at 2 months. Results in BD are averages ± SD.
Fig. 6.
Fig. 6.
Histochemical analyses of liver cross sections from C3H/HeJ mice that had received adoptive splenocyte transfer and Ad-hF.IX vector (2-month time point; animals are identical to those used for Fig. 5). (AD) Immunostaining for hF.IX (red). (E and F) Immunostaining for CD8 (green). (FJ) Hematoxylin and eosin staining. Mice had received adoptive transfer of CD4+ cells from AAV-hF.IX-transduced mice (A, B, E, and G) or from naïve controls (D, F, and J) or CD4-depleted cells from AAV-hF.IX-transduced mice (C and H) or from naïve controls (I). (Original magnification: ×100.)
Fig. 7.
Fig. 7.
Analyses of splenocyte populations in C3H/HeJ mice, which were naïve (open bars), had received Ad-hF.IX only (shaded bars), or had received hepatic AAV-hF.IX gene transfer 10 weeks before Ad-hF.IX administration (filled bars). Splenocytes were isolated 10 days after adenoviral gene transfer. Shown are the percentage of CD4+CD62L+ of total splenocytes (A) and the percentage of CD4+CD25+GITR+ of total splenocytes (B) as determined by flow cytometry. (C) Levels of FoxP3 mRNA in CD4+ splenocytes relative to naïve controls (which were set as 100%) as measured by quantitative RT-PCR. Results are average ± SD for n = 4 mice per experimental group.

References

    1. Herzog R. W., Dobrzynski E. Semin. Thromb. Hemostasis. 2004;30:215–226. - PubMed
    1. Sabatino D. E., Armstrong E., Edmonson S., Liu Y. L., Pleimes M., Schuettrumpf J., Fitzgerald J., Herzog R. W., Arruda V. R., High K. A. Blood. 2004;104:2767–2774. - PubMed
    1. Yang Y., Ertl H. C., Wilson J. M. Immunity. 1994;1:433–442. - PubMed
    1. Yang Y., Xiang Z., Ertl H. C., Wilson J. M. Proc. Natl. Acad. Sci. USA. 1995;92:7257–7261. - PMC - PubMed
    1. Jooss K., Ertl H. C., Wilson J. M. J. Virol. 1998;72:2945–2954. - PMC - PubMed

Publication types