. 2006 Mar 21;103(12):4783-8.
doi: 10.1073/pnas.0509634103. Epub 2006 Mar 13.

Strength of early visual adaptation depends on visual awareness

Affiliations

Strength of early visual adaptation depends on visual awareness

Randolph Blake et al. Proc Natl Acad Sci U S A. .

Abstract

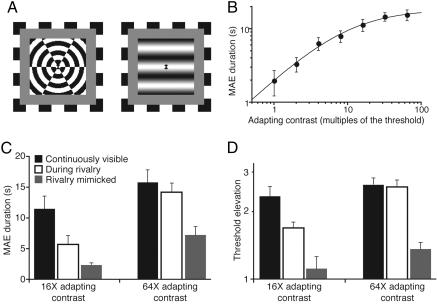
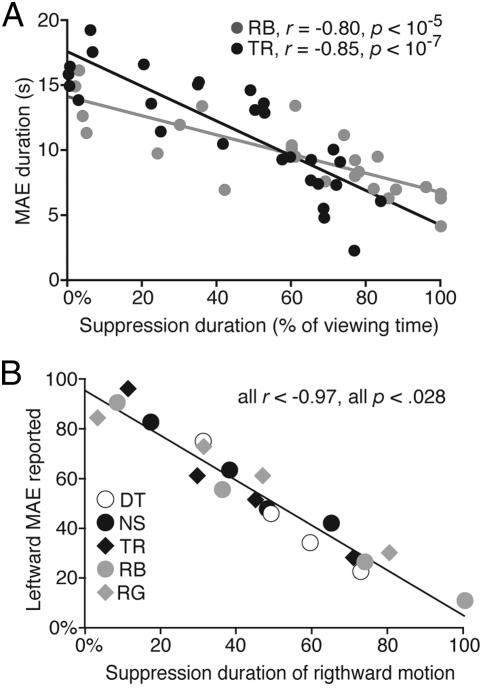
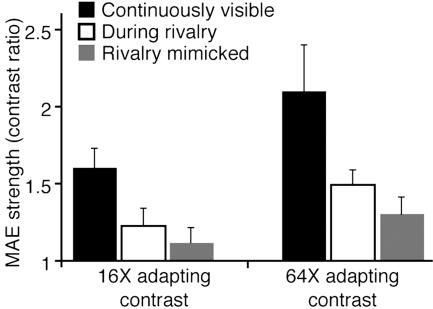
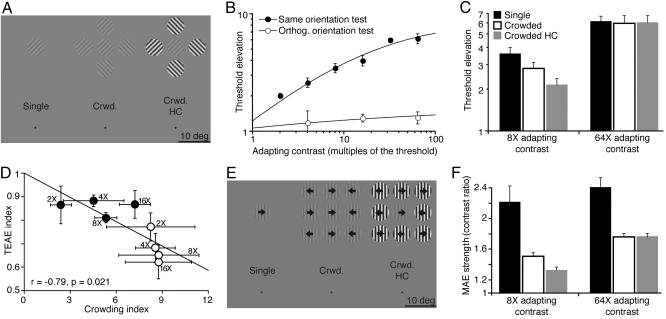
We measured visual-adaptation strength under variations in visual awareness by manipulating phenomenal invisibility of adapting stimuli using binocular rivalry and visual crowding. Results showed that the threshold-elevation aftereffect and the translational motion aftereffect were reduced substantially during binocular rivalry and crowding. Importantly, aftereffect reduction was correlated with the proportion of time that the adapting stimulus was removed from visual awareness. These findings indicate that the neural events that underlie both rivalry and crowding are inaugurated at an early stage of visual processing, because both the threshold-elevation aftereffect and translational motion aftereffect arise, at least in part, from adaptation at the earliest stages of cortical processing. Also, our findings make it necessary to reinterpret previous studies whose results were construed as psychophysical evidence against the direct role of neurons in the primary visual cortex in visual awareness.


Conflict of interest statement

Conflict of interest statement: No conflicts declared.

Figures

Fig. 1.
Fig. 1.
Effects of binocular rivalry and crowding could remain latent at high adapting contrasts. Dashed arrows indicate the effect that a modest reduction in effective contrast would have on aftereffect strength at a high and an intermediate adapting contrast.
Fig. 2.
Fig. 2.
Results from binocular-rivalry experiments. Error bars indicate SEM. (A) Rival stimuli used in TEAE and MAE experiments. (B) Static MAE duration as a function of the adapting contrast. The data are fitted with Naka–Rushton function (with 300 ms subtracted from each data value to compensate for motor reaction time). (C) Static MAE duration in different viewing conditions at two adapting contrasts. (D) TEAE in different viewing conditions at two adapting contrasts.
Fig. 3.
Fig. 3.
The relationship between the adapting stimulus visibility and the resulting aftereffect. (A) Static MAE duration for two observers as a function of the percentage of time the adapting grating was suppressed. Straight lines are linear fits to each observer’s data. (B) Proportion of trials in which leftward MAE was experienced as a function of the percentage of time that the right-moving grating was suppressed. The data for each of five observers were sorted into four 25-trial bins, with the x-axis position indicating the mean of each bin. The straight line is the average linear fit to the data.
Fig. 4.
Fig. 4.
Dynamic MAE strength in different viewing conditions at two adapting contrasts.
Fig. 5.
Fig. 5.
Results from crowding experiments. Error bars indicate SEM. (A) Stimuli that were used to measure TEAE in three different viewing conditions. In all conditions, the observer fixated a small, circular spot located 25° directly below the middle of the adapting grating. (B) Threshold elevation as a function of the adapting contrast. The data are fitted with the Naka–Rushton function. (C) Threshold elevation in different viewing conditions at two adapting contrasts. (D) The relationship between the TEAE index (TEAE strength when crowded/TEAE strength in isolation) and the crowding index (orientation threshold when crowded/orientation threshold in isolation). Numbers by the data points indicate the adapting contrast. Filled and open circles show the data for the crowded and crowded HC conditions, respectively. (E) Stimuli used for dynamic MAE measurements. (F) Dynamic MAE strength in different viewing conditions at two adapting contrasts.

Similar articles

Cited by

References

    1. Frisby J. Seeing: Illusion, Brain and Mind. Oxford: Oxford Univ. Press; 1979.
    1. Kim C.-Y., Blake R. Trends Cognit. Sci. 2005;9:381–388. - PubMed
    1. Blake R., Fox R. Nature. 1974;249:488–490. - PubMed
    1. Lehmkuhle S. W., Fox R. Vision Res. 1975;15:855–859. - PubMed
    1. O’Shea R. P., Crassini B. Vision Res. 1981;21:801–804. - PubMed

Publication types

LinkOut - more resources