. 2006 Mar 21;103(12):4753-8.
doi: 10.1073/pnas.0509378103. Epub 2006 Mar 13.

Imaging cellular signals in the heart in vivo: Cardiac expression of the high-signal Ca2+ indicator GCaMP2

Affiliations

Imaging cellular signals in the heart in vivo: Cardiac expression of the high-signal Ca2+ indicator GCaMP2

Yvonne N Tallini et al. Proc Natl Acad Sci U S A. .

Abstract

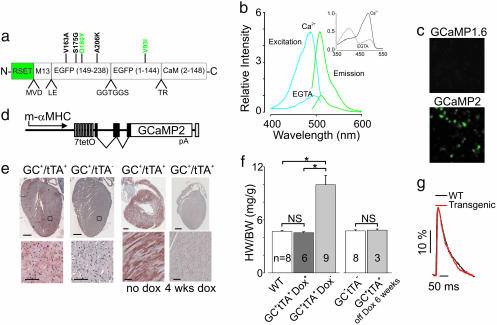
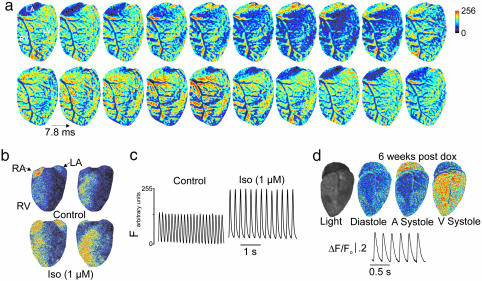
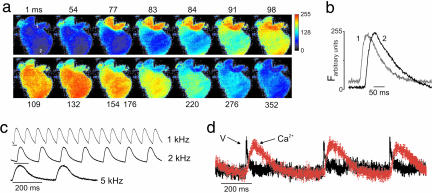
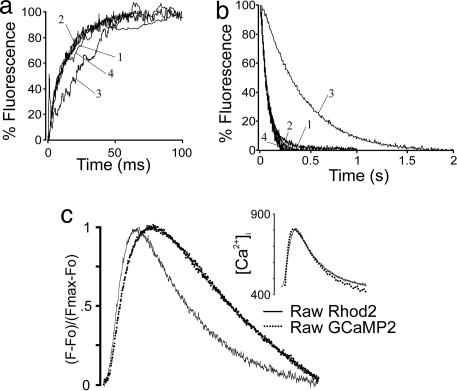
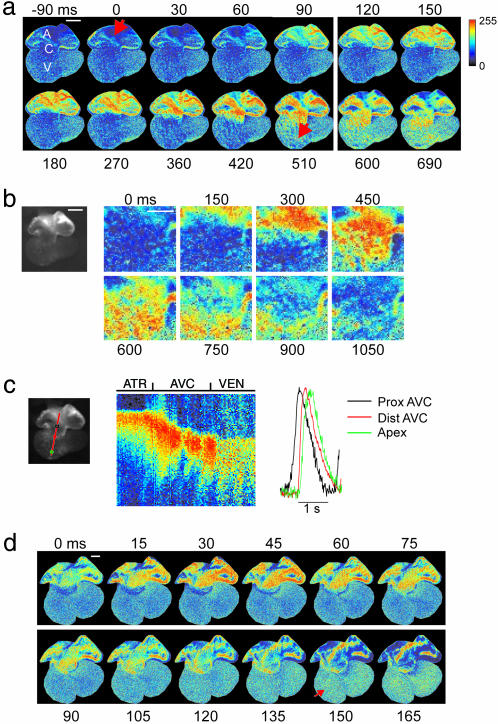
Genetically encoded sensor proteins provide unique opportunities to advance the understanding of complex cellular interactions in physiologically relevant contexts; however, previously described sensors have proved to be of limited use to report cell signaling in vivo in mammals. Here, we describe an improved Ca(2+) sensor, GCaMP2, its inducible expression in the mouse heart, and its use to examine signaling in heart cells in vivo. The high brightness and stability of GCaMP2 enable the measurement of myocyte Ca(2+) transients in all regions of the beating mouse heart and prolonged pacing and mapping studies in isolated, perfused hearts. Transgene expression is efficiently temporally regulated in cardiomyocyte GCaMP2 mice, allowing recording of in vivo signals 4 weeks after transgene induction. High-resolution imaging of Ca(2+) waves in GCaMP2-expressing embryos revealed key aspects of electrical conduction in the preseptated heart. At embryonic day (e.d.) 10.5, atrial and ventricular conduction occur rapidly, consistent with the early formation of specialized conduction pathways. However, conduction is markedly slowed through the atrioventricular canal in the e.d. 10.5 heart, forming the basis for an effective atrioventricular delay before development of the AV node, as rapid ventricular activation occurs after activation of the distal AV canal tissue. Consistent with the elimination of the inner AV canal muscle layer at e.d. 13.5, atrioventricular conduction through the canal was abolished at this stage. These studies demonstrate that GCaMP2 will have broad utility in the dissection of numerous complex cellular interactions in mammals, in vivo.


Conflict of interest statement

Conflict of interest statement: No conflicts declared.

Figures

Fig. 1.
Fig. 1.
Conditional cardiac GCaMP2 mice (ccGC2). (a) GCaMP2 consists of circularly permutated eGFP with the molecule interrupted at residue 145 and a 13-residue peptide of myosin light chain kinase (M13) and calmodulin (CaM), placed at the new N and C termini, respectively. An RSET polyHis peptide was introduced N-terminal to the original methionine reported as part of GCaMP1 (11). Mutations resulting in augmented brightness and thermal stability are shown in green. (b) Excitation and emission spectra for GCaMP2 in chelating (10 mM EGTA) and saturating (10 mM) Ca2+ solutions. At saturating Ca2+, the spectral characteristics are similar to eGFP (Table 1). (Inset) Absorption spectra. (c) Comparison of brightness/thermal stability of GCaMP1.6 and GCaMP2 in transiently transfected HEK cells cultured at 37°C for 1 day indicates retention of brightness in GCaMP2. Images were obtained in unstimulated cells at ×20 magnification by using the same exposure time and camera gain. (d) Transgene design including the weakened αMHC promoter, tet operator sequences (tetO), noncoding exons, kozak sequence, GCaMP2 cDNA sequence, and polyA recognition sequence. (e) Control of transgene expression by tTA (left two images) and silencing of transgene after 4 weeks of doxycycline (dox) administration (right two images). GCaMP2 was detected by anti-GFP staining (38); areas of sections (Lower) are indicated by boxes. [Scale bars: 1 mm (Upper) and 100 μm (Lower).] (f) Heart weight/body weight (HW/BW) ratios of age-, sex-, and litter-matched mice. Hearts from ccGC2 transgenic mice maintained on dox from birth were not significantly (NS) different from control (one-way ANOVA), whereas double transgenic mice not maintained on dox had significant heart enlargement (∗, P < 0.05). Cardiomegaly was prevented by maintenance of mice on dox, followed by removal at 13–15 weeks. (g) Optical Ca2+ transients recorded in isolated/perfused WT and ccGC2 hearts indicate that the Ca2+ transient is not altered by expression of the transgene. Hearts were transiently loaded with Rhod2 and paced at 350/min, and an equivalent ventricular region was recorded by using a photodiode array (40).
Fig. 2.
Fig. 2.
In vivo Ca2+ signaling. (a) Sequential images of Ca2+–dependent fluorescence during a single cardiac cycle in an anesthetized and ventilated mouse. Images were obtained at 128 Hz with an Andor iXon camera. Note lack of fluorescence in cardiac vasculature and decline of ventricular Ca2+ transient during beginning of atrial systole (very top of image) (full sequence available in Movie 1). (b) Ca2+ fluorescence in a 1-day-old mouse in vivo. Images at peak atrial and ventricular systole are shown from a series obtained at 33 Hz. Sequences show before (Upper) and directly after (Lower) direct application of 10 μM isoproterenol (Iso). The heart is illuminated obliquely from the left side of the camera, highlighting right atrium (RA) and ventricle (RV); each series was separately scaled from 0 to 255 (LA, left atrium). See also Movie 3. (c Left) Ca2+ transients recorded from the atrium (3 × 3 pixels) in experiment shown in b; (Right) transients recorded from same heart after direct application of 10 μM iso. (d) In vivo images from a phenotypically normal heart after transgene induction by dox removal. Images show diastole and peak atrial (A) and ventricular (V) systole. Continuous ventricular fluorescence from full experiment is shown below. Color scale in a applies throughout.
Fig. 3.
Fig. 3.
In vitro Ca2+ signaling. (a) Single spontaneous contraction in an isolated, perfused adult heart recorded at 1 kHz with a Micam Ultima 100 × 100 pixel CMOS camera. Images are selected to show major phases of the conduction of the atrial and ventricular Ca2+ wave (full sequence available in Movie 3). (b) Fluorescence from a single pixel in atrium and ventricle from series shown in a (area indicated in first frame; ≈40 × 40-μm area). (c) Typical transients recorded with a CMOS camera showing signal/noise characteristics of ventricular Ca2+ transients at different pacing rates. Transients are unprocessed fluorescence values from a single pixel recorded at the frame rates indicated at right, normalized for comparison. (d) Simultaneous recording of action potential (RH237) and GCaMP2 Ca2+ transient from same ventricular (V) region with a photodiode array.
Fig. 4.
Fig. 4.
Kinetics of GCaMP2. (a) Fluorescence association kinetics in stop-flow experiment. Traces 1–3 are dilutions of GCaMP2 cardiac cytosol and protein in solution. Trace 4 is cardiac cytosol recorded at 20°C. Values for exponential fits and full conditions are in Table 1. Note equivalence of association time course despite different Ca2+ jump levels and/or purified protein or cardiac cytosol (traces 1, 2, and 4). (b) Dissociation kinetics in same conditions as a. Note markedly slowed off-rate at 20°C (trace 3). (c) Simultaneous recordings of Rhod2 and GCaMP2 Ca2+ fluorescence. Average raw fluorescence values from five sequential cycles obtained from the same ≈30-μm2 region of ventrical are shown (pacing rate = 300 per min). Note more rapid rise time and decay of Rhod2 signal. (Inset) Conversion of both signals to free Ca2+ and adjustment of GCaMP2 signal for association and dissociation kinetics.
Fig. 5.
Fig. 5.
Ca2+ Signaling in the developing heart. (a) Sequential images of activation of e.d. 10.5 heart during spontaneous beating (dorsal surface); A, atrium; C, canal; V, ventricle. Arrow in second image shows initial activation of atrium. Note slow passage of Ca2+ wave through the AV canal (AVC) and progression into ventricle. Ventricular activation at apex (arrow at 510 ms) occurs independently after passage through AVC. (b) Passage of cytosolic Ca2+ wave through the AVC region shown in box on image at Left. Shown is the e.d. 10.5 dorsal surface. (c) Virtual linescan (line of scan shown on image at Left; pseudolinescan in Center) taken from a 67-Hz series of images during spontaneous activation of an e.d. 10.5 heart. Ca2+ transients from the areas shown (circles) are shown at right. Note the short time interval between the beginning of the distal AVC and ventricular apex transients (ATR, atria; VEN, ventricle). (d) Images of Ca2+ fluorescence during spontaneous activation of an e.d. 13.5 heart (dorsal surface, 67 Hz). Note that Ca2+ wave ends in a ring at base of compacted AVC and does not extend into the ventricle. Arrow shows breakthrough of Ca2+ wave at ventricular apex. (Scale bars: 250 μm.) Color scale in a applies throughout.

References

    1. Berridge M. J., Irvine R. F. Nature. 1984;312:315–321. - PubMed
    1. Tsien R. W., Tsien R. Y. Annu. Rev. Cell Biol. 1990;6:715–760. - PubMed
    1. Bootman M. D., Berridge M. J. Cell. 1995;83:675–678. - PubMed
    1. Clapham D. E. Cell. 1995;80:259–268. - PubMed
    1. Berridge M. J., Bootman M. D., Lipp P. Nature. 1998;395:645–648. - PubMed

Publication types

MeSH terms

Substances

Associated data