

Modeling the role of bacteriophage in the control of cholera outbreaks
- PMID: 16537404
- PMCID: PMC1450226
- DOI: 10.1073/pnas.0600166103
Modeling the role of bacteriophage in the control of cholera outbreaks
Abstract
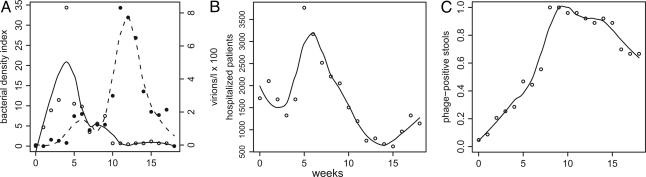
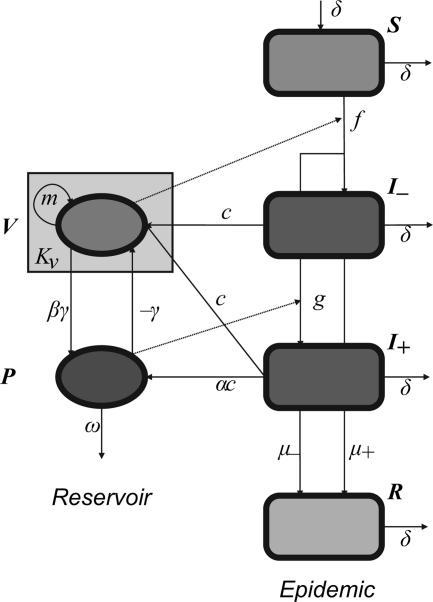
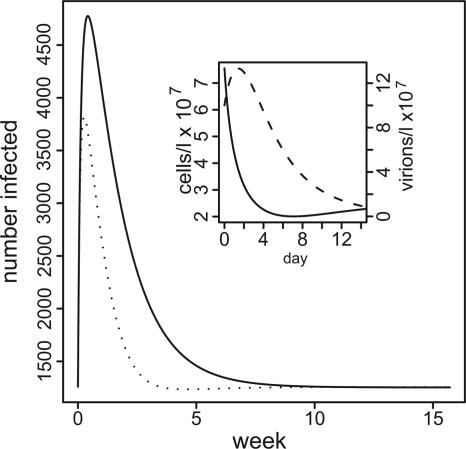
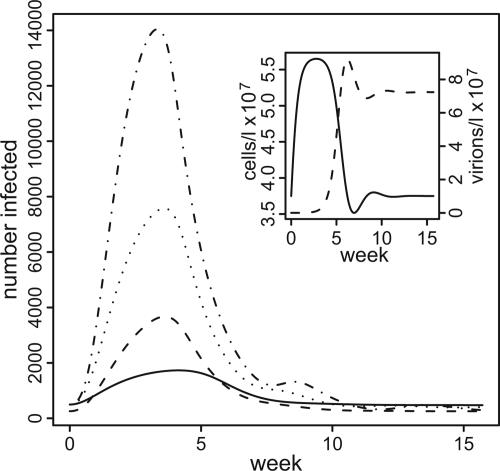
Cholera is a waterborne diarrheal disease that continues to plague the developing world. Individuals become infected by consuming water from reservoirs contaminated by virulent strains of the bacterium Vibrio cholerae. Epidemiological and environmental observations of a cholera outbreak in Dhaka, Bangladesh, suggest that lytic bacteriophage specific for V. cholerae may limit the severity of cholera outbreaks by killing bacteria present in the reservoir and in infected individuals. To quantify this idea and generate testable hypotheses, we analyzed a mathematical model that combines the epidemiology of cholera with the population dynamics of the bacteria and phage. Under biologically reasonable conditions, we found that vibriophage can ameliorate cholera outbreaks. If phage predation limits bacterial density before an outbreak, a transient reduction in phage density can disrupt that limitation, and subsequent bacterial growth can initiate a cholera outbreak. The severity of the outbreak depends on the density of phage remaining in the reservoir. If the outbreak is initiated instead by a rise in bacterial density, the introduction of phage can reduce the severity of the outbreak and promote its decline. In both situations, the magnitude of the phage effect depends mainly on vibrio growth and phage mortality rates; the lower the rates, the greater the effect. Our analysis also suggests that either bacteria in the environmental reservoir are hyperinfectious or most victims ingest bacteria amplified in food or drinking water contaminated by environmental water carrying few viable V. cholerae. Our theoretical results make a number of empirically testable predictions.
Conflict of interest statement
Conflict of interest statement: No conflicts declared.
Figures

Similar articles
-
Presence of lysogenic phage in the outbreak strains of Vibrio cholerae O139.J Med Microbiol. 1995 Jun;42(6):399-403. doi: 10.1099/00222615-42-6-399. J Med Microbiol. 1995. PMID: 7791203
-
Self-limiting nature of seasonal cholera epidemics: Role of host-mediated amplification of phage.Proc Natl Acad Sci U S A. 2005 Apr 26;102(17):6119-24. doi: 10.1073/pnas.0502069102. Epub 2005 Apr 13. Proc Natl Acad Sci U S A. 2005. PMID: 15829587 Free PMC article.
-
Niche adaptation limits bacteriophage predation of Vibrio cholerae in a nutrient-poor aquatic environment.Proc Natl Acad Sci U S A. 2019 Jan 29;116(5):1627-1632. doi: 10.1073/pnas.1810138116. Epub 2019 Jan 11. Proc Natl Acad Sci U S A. 2019. PMID: 30635420 Free PMC article.
-
Vibrio cholerae infection, novel drug targets and phage therapy.Future Microbiol. 2011 Oct;6(10):1199-208. doi: 10.2217/fmb.11.93. Future Microbiol. 2011. PMID: 22004038 Review.
-
Mechanisms of the evolutionary arms race between Vibrio cholerae and Vibriophage clinical isolates.Int Microbiol. 2017 Sep;20(3):116-120. doi: 10.2436/20.1501.01.292. Int Microbiol. 2017. PMID: 29446802 Free PMC article. Review.
Cited by
-
The Type II Secretory System Mediates Phage Infection in Vibrio cholerae.Front Cell Infect Microbiol. 2021 Apr 16;11:662344. doi: 10.3389/fcimb.2021.662344. eCollection 2021. Front Cell Infect Microbiol. 2021. PMID: 33968805 Free PMC article.
-
How does feedback from phage infections influence the evolution of phase variation in Campylobacter?PLoS Comput Biol. 2021 Jun 14;17(6):e1009067. doi: 10.1371/journal.pcbi.1009067. eCollection 2021 Jun. PLoS Comput Biol. 2021. PMID: 34125841 Free PMC article.
-
An experimental study of the population and evolutionary dynamics of Vibrio cholerae O1 and the bacteriophage JSF4.Proc Biol Sci. 2010 Nov 7;277(1698):3247-54. doi: 10.1098/rspb.2010.0651. Epub 2010 Jun 10. Proc Biol Sci. 2010. PMID: 20538647 Free PMC article.
-
A Molecular and Epidemiological Study of Cholera Outbreak in Sulaymaniyah Province, Iraq, in 2022.Pol J Microbiol. 2023 Mar 24;72(1):39-46. doi: 10.33073/pjm-2023-008. Print 2023 Mar 1. Pol J Microbiol. 2023. PMID: 36929893 Free PMC article.
-
Effect of phage on the infectivity of Vibrio cholerae and emergence of genetic variants.Infect Immun. 2008 Nov;76(11):5266-73. doi: 10.1128/IAI.00578-08. Epub 2008 Sep 15. Infect Immun. 2008. PMID: 18794293 Free PMC article.
References
Publication types
MeSH terms
Grants and funding
LinkOut - more resources
Full Text Sources
Other Literature Sources
Medical
