. 2006 Mar 21;103(12):4344-51.
doi: 10.1073/pnas.0600084103. Epub 2006 Mar 14.

SynGAP regulates synaptic strength and mitogen-activated protein kinases in cultured neurons

Affiliations

SynGAP regulates synaptic strength and mitogen-activated protein kinases in cultured neurons

Gavin Rumbaugh et al. Proc Natl Acad Sci U S A. .

Abstract

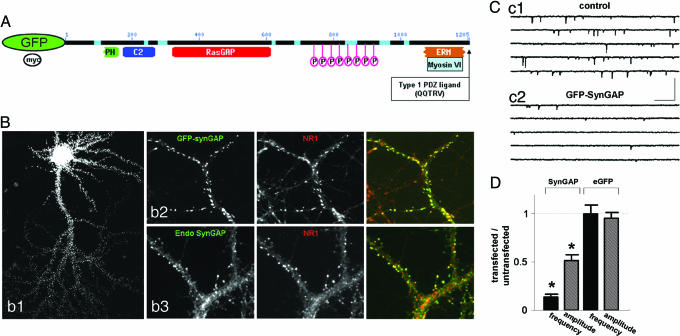
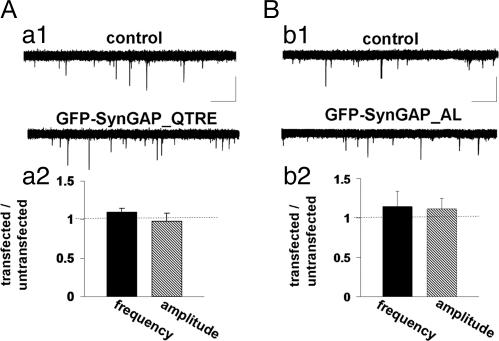
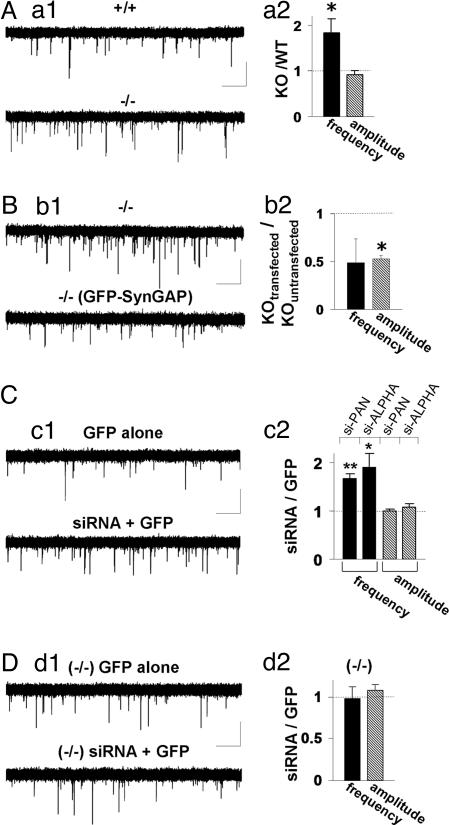
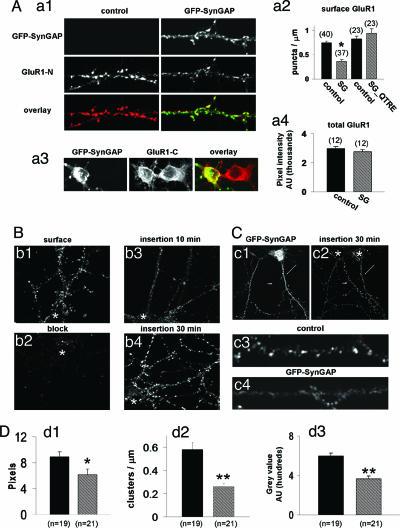
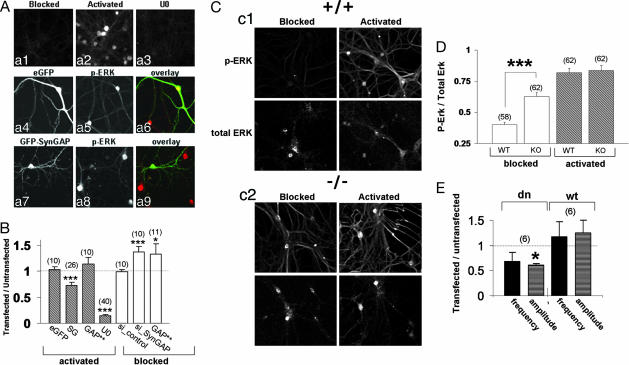
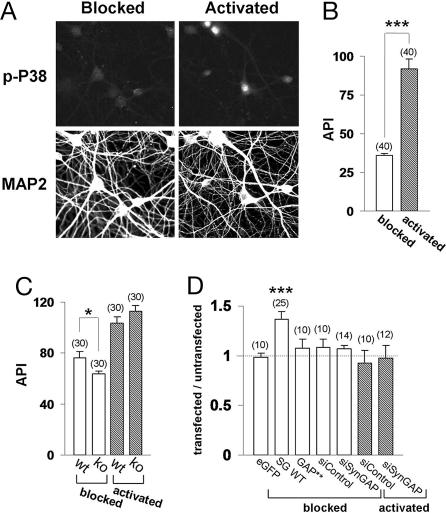
Silent synapses, or excitatory synapses that lack functional alpha-amino-3-hydroxy-5-methyl-4-isoxazolepropionic acid receptors (AMPARs), are thought to be critical for regulation of neuronal circuits and synaptic plasticity. Here, we report that SynGAP, an excitatory synapse-specific RasGAP, regulates AMPAR trafficking, silent synapse number, and excitatory synaptic transmission in hippocampal and cortical cultured neurons. Overexpression of SynGAP in neurons results in a remarkable depression of AMPAR-mediated miniature excitatory postsynaptic currents, a significant reduction in synaptic AMPAR surface expression, and a decrease in the insertion of AMPARs into the plasma membrane. This change is specific for AMPARs because no change is observed in synaptic NMDA receptor expression or total synapse density. In contrast to these results, synaptic transmission is increased in neurons from SynGAP knockout mice as well as in neuronal cultures treated with SynGAP small interfering RNA. In addition, activation of the extracellular signal-regulated kinase, ERK, is significantly decreased in SynGAP-overexpressing neurons, whereas P38 mitogen-activated protein kinase (MAPK) signaling is potentiated. Furthermore, ERK activation is up-regulated in neurons from SynGAP knockout mice, whereas P38 MAPK function is depressed. Taken together, these data suggest that SynGAP plays a critical role in the regulation of neuronal MAPK signaling, AMPAR membrane trafficking, and excitatory synaptic transmission.


Conflict of interest statement

Conflict of interest statement: Under a licensing agreement between Upstate Group, Inc. and the Johns Hopkins University, R.L.H. is entitled to a share of royalty received by the University on sales of products described in this article. R.L.H. is a paid consultant to Upstate Group, Inc. The terms of this arrangement are being managed by the Johns Hopkins University in accordance with its conflict of interest policies.

Figures

Fig. 1.
Fig. 1.
SynGAP overexpression results in decreased synaptic function. (A) Schematic of GFP-SynGAP fusion protein outlining various domains of interest. (B) Expression of GFP-SynGAP in cultured neurons. (Bb1) Low magnification of a cultured neuron expressing GFP-SynGAP for 16 h. (Bb2) GFP-SynGAP-expressing neurons were immunolabeled for GFP and NR1. (Bb3) Similar neurons were also labeled with antibodies detecting endogenous SynGAP (endo-SynGAP) and NR1. (Cc1) Whole-cell patch-clamp recording from an untransfected (control) cultured neuron. Recording solution allowed isolation of mEPSCs only from AMPARs. (Cc2) Whole-cell patch-clamp recording from a GFP-SynGAP-expressing neuron. This recording was obtained from a neuron adjacent to that in Cc1. (Calibration: 250 ms, 100 pA.) (D) Normalized AMPAR-mEPSCs from GFP-SynGAP- or eGFP-expressing neurons. To arrive at the normalized values, averages of frequency and amplitudes of mini events were taken from each recorded neuron. The average frequency (Hz) and amplitude (pA) from each neuron were then averaged to give a value for the entire population (untransfected = 2.59 ± 0.46 Hz, 18.8 ± 0.91 pA, n = 11; GFP-SynGAP = 0.37 ± 0.09 Hz, 9.77 ± 0.91 pA, n = 11). The average of the transfected population was normalized to the average of the untransfected (control) population to illustrate the overall effect of the expressed protein on each mEPSC parameter. Hence, values less than one represent a decrease in overall synaptic function, whereas values greater than one represent an increase. Statistical significance was determined by a Student's t test (two-tailed). n corresponds to the number of neurons in each population. This methodology is applied to all subsequent mEPSC plots. ∗, P < 0.001.
Fig. 2.
Fig. 2.
PDZ binding and GAP activity are required for SynGAP function. (Aa1) Representative recordings from either an untransfected (control) or GFP-SynGAP_QTRE-expressing neuron. Five sequential traces from each neuron are overlaid to illustrate relative mEPSC frequency and amplitudes between neurons. (Aa2) Normalized mEPSC amplitude and frequency from both GFP-SynGAP_QTRE and control populations (untransfected = 3.73 ± 0.57 Hz, 15.6 ± 1.1 pA, n = 10; GFP-SynGAP_QTRE = 4.09 ± 0.04 Hz, 15.3 ± 1.7 pA, n = 11). (Calibration: 600 ms, 20 pA.) (B) Representative recordings from either an untransfected (control) or GFP-SynGAP_AL-expressing neuron. Five sequential traces from each neuron are overlaid to illustrate relative mEPSC frequency and amplitudes. (Bb2) Normalized mEPSC amplitude and frequency from both GFP-SynGAP_AL and control populations (untransfected = 0.92 ± 0.19 Hz, 11.9 ± 1.3 pA, n = 8; GFP-SynGAP_AL = 1.05 ± 0.38 Hz, 12.9 ± 2.1 pA, n = 8). (Calibration: 600 ms, 20 pA.)
Fig. 3.
Fig. 3.
Decreased SynGAP expression results in enhancement of synaptic transmission. (Aa1) Representative recordings from either WT (+/+) or SynGAP-null (−/−) neurons. Five sequential traces from each neuron are overlaid to illustrate relative mEPSC frequency and amplitude. (Aa2) Normalized mEPSC amplitude and frequency from both populations (+/+ = 1.45 ± 0.25 Hz, 18.5 ± 1.0 pA, n = 17; −/− = 2.67 ± 0.45 Hz, 16.9 ± 0.79 pA, n = 17). (Calibration: 1 s, 20 pA.) ∗, P < 0.05. (Bb1) Representative recordings from either an untransfected neuron or GFP-SynGAP-expressing neurons derived from SynGAP-null (−/−) mice. Five sequential traces from each neuron are overlaid to illustrate relative mEPSC frequency and amplitudes. (Bb2) Normalized mEPSC amplitude and frequency from all cells in each population [−/− = 4.85 ± 0.78 Hz, 14.3 ± 1.9 pA, n = 5; GFP-SynGAP (−/−) = 2.34 ± 1.2 Hz, 9.45 ± 0.37 pA, n = 5]. (Calibration: 1 s, 20 pA.) ∗, P < 0.05. (Cc1) siRNAs and eGFP were cotransfected together, and recordings were performed after 72 h. These recordings were compared with neurons expressing eGFP alone for at least 72 h. In each condition, recordings illustrated are five, 5-sec traces that have been superimposed. (Cc2) si-PAN- or si-ALPHA-expressing neurons were normalized to eGFP-only-expressing neurons for both mEPSC frequency and amplitude (si-PAN: GFP = 1.50 ± 0.20 Hz, 12.5 ± 0.53 pA, n = 16; GFP + siRNA = 2.53 ± 0.27 Hz, 12.5 ± 0.62 pA, n = 17; si-ALPHA: GFP = 4.42 ± 0.99 Hz, 14.8 ± 1.5 pA, n = 13; GFP + siRNA = 8.42 ± 1.3 Hz, 15.8 ± 1.2 pA, n = 13). Black bars, mEPSC frequency; gray bars, mEPSC amplitude. (Calibration: 1 s, 20 pA.) ∗, P < 0.05; ∗∗, P < 0.01. (Dd1) siRNAs and eGFP were cotransfected together and recordings were carried out after 72 h by using neurons derived from SynGAP-null mice (−/−). These recordings were compared with neurons expressing only eGFP after 72 h. In each condition the recordings illustrated are five, 5-sec traces that have been superimposed. (Dd2) siRNA-expressing neurons were normalized to eGFP-only-expressing neurons for both mEPSC frequency and amplitude in SynGAP-null mice [(−/−) GFP = 7.59 ± 2.03 Hz, 12.2 ± 2.27 pA, n = 6; (−/−) siRNA + GFP = 7.41 ± 1.67 Hz, 22.8 ± 1.27 pA, n = 6]. (Calibration: 500 ms, 20 pA.)
Fig. 4.
Fig. 4.
SynGAP alters AMPAR trafficking. (Aa1) GFP-SynGAP and untransfected (control) neurons were labeled with N-terminal GluR1 polyclonal antibodies (GluR1-N; JH1816). Dendrites originate from neurons on the same coverslip and in close proximity to each other. (Aa2) Quantification of GluR1 surface puncta after transfection with either GFP-SynGAP (SG) or GFP-SynGAP_QTRE (SG_QTRE). Data represent numbers of detected GluR1 clusters per unit dendrite length. ∗, P < 0.001. (Aa3) Shown are neighboring somas from either a control neuron (right soma, untransfected) or GFP-SynGAP-expressing (left soma) neuron. Both are labeled with GluR1-C antibodies. (Aa4) Quantification of total GluR1 expression. (Bb1) Cy3-conjugated GluR1-N antibodies were applied to cultures in nontrafficking conditions (10°C) to label only surface receptors. (Bb2) Neurons were first labeled with unconjugated GluR1-N antibodies before being labeled with Cy3-conjugated GluR1-N antibodies (10°C). (Bb3) Neurons were blocked with unlabeled GluR1-N antibodies (10°C) and subsequently placed at 37°C with Cy3-GluR1-N for 10 min (insertion 10 min). (Bb4) Neurons were blocked with unlabeled GluR1-N antibodies (10°C) and subsequently placed at 37°C with Cy3-GluR1-N for 30 min (insertion 30 min). Images were acquired with equal parameters and were scaled identically illustrating true relative differences in signal intensity among conditions. Asterisk, location of soma. (Cc1) Dendrite from a GFP-SynGAP-transfected neuron (arrow) adjacent to a dendrite from an untransfected neuron (arrowhead). (Cc2) Insertion 30-min signal showing newly inserted AMPARs from either an untransfected neuron (arrowhead) or a GFP-SynGAP-expressing neuron (arrow). (Cc3 and Cc4) Higher-resolution images of newly inserted AMPARs from either a GFP-SynGAP-expressing neuron or an untransfected neuron (control). Dendrites were taken from neurons shown in Cc2 in the vicinity of the arrow (GFP-SynGAP) and the arrowhead (untransfected). Asterisk, location of soma. (D) Quantification of data from C (black bars, untransfected; hatched bars, GFP-SynGAP). (Dd1) Average cluster area represents the pixel area from all puncta detected in all dendrites measured. (Dd2) Cluster density represents number of detected objects from a thresholded dendrite. The average number of objects per length of dendrite was then calculated. (Dd3) Average pixel intensity represents the average gray level from a single pixel from a single cluster of newly inserted receptors. ∗∗, P < 0.01; ∗, P < 0.05.
Fig. 5.
Fig. 5.
SynGAP suppresses ERK activity. (Aa1Aa3) Neurons were transferred to a media containing 1 μM tetrodotoxin, 10 μM 2,3-dihydroxy-6-nitro-7-sulfamoylbenzo[f]quinoxaline, and 100 μM 2-amino-5-phosphonovaleric acid for 5 min (blocked). (Aa2) Neurons undergoing activation (5 min) were placed in artificial cerebrospinal fluid free of synaptic blockers and MgCl2 that included 100 μM glycine. (Aa3) Neurons were first pretreated with 10 μM U0126 for 30 min and then treated as in Aa2. All neurons were then labeled with antibodies that detect phosphorylated ERK. (Aa4Aa9) Neurons were first transfected with either eGFP (Aa4Aa6) or GFP-SynGAP (Aa7Aa9), then activated (as in Aa2), and finally labeled with phospho-ERK antibodies. (B) Quantification of phosphorylated ERK immunofluorescence from neurons expressing eGFP, GFP-SynGAP (SG), GFP-SynGAP_AL (GAP**), SynGAP-targeted siRNA (si_PAN), or control siRNA. The intensity of transfected neurons was normalized to untransfected neighboring neurons. U0, ratio of neurons pretreated with U0126 to neurons pretreated with DMSO. Filled bars, activated (as in Aa2); open bars, blocked (as in Aa1). ∗∗∗, P < 0.001. (Cc1) WT (+/+) neurons were either blocked or activated (see Aa1 and Aa2) and then labeled with both phospho-ERK (p-ERK) and pan-ERK (total ERK) antibodies. (Cc2) Neurons from SynGAP-null mice (−/−) were blocked or activated and then labeled with both phospho-ERK (p-ERK) and pan-ERK (total ERK) antibodies. (D) Quantification of data from phosphorylated ERK immunocytochemical labeling in neurons from WT and SynGAP KO mice. Normalized values were derived from dividing p-ERK integrated intensity by total Erk integrated intensity from either WT or KO neurons (see Materials and Methods). Open bars, blocked; filled bars, activated. ∗∗∗, P < 0.01. (E) Normalized AMPAR mEPSCs from neurons expressing a dominant negative (dn) or WT (wt) form of ERK2. Black bars, mEPSC frequency; gray bars, mEPSC amplitude. ∗, P < 0.05.
Fig. 6.
Fig. 6.
SynGAP enhances P38 signaling. (A) Neurons were either blocked or activated as above, except that the stimulation duration was increased to 10 min. Neurons were then immunolabeled with phospho-P38 (p-P38) and microtubule-associated protein 2 (MAP2) antibodies. (B) Quantification of phospho-P38 signal [average pixel intensity (API)] in neurons. ∗∗∗, P < 0.001. (C) Quantification of data (average pixel intensity) from phosphorylated P38 labeling of neurons derived from WT or SynGAP KO mice. Open bars, blocked; filled bars, activated. ∗, P < 0.01. (D) Quantification of phosphorylated P38 immunofluorescence from either blocked or activated neurons expressing eGFP, GFP-SynGAP, GFP-SynGAP_AL (GAP**), or siRNA (si_PAN) constructs. The intensity of transfected neurons was normalized to untransfected neighboring neurons. ∗∗∗, P < 0.001.

Comment in

  • Profile of Richard L. Huganir.
    Davis TH. Davis TH. Proc Natl Acad Sci U S A. 2006 Mar 21;103(12):4341-3. doi: 10.1073/pnas.0601079103. Epub 2006 Mar 13. Proc Natl Acad Sci U S A. 2006. PMID: 16537364 Free PMC article. No abstract available.

Similar articles

Cited by

References

    1. McBain C., Dingledine R. J. Neurophysiol. 1992;68:16–27. - PubMed
    1. Forsythe I. D., Westbrook G. L. J. Physiol. (London) 1988;396:515–533. - PMC - PubMed
    1. Hestrin S., Nicoll R. A., Perkel D. J., Sah P. J. Physiol. (London) 1990;422:203–225. - PMC - PubMed
    1. Song I., Huganir R. L. Trends Neurosci. 2002;25:578–588. - PubMed
    1. Malinow R. Philos. Trans. R. Soc. London B. 2003;358:707–714. - PMC - PubMed

Publication types

MeSH terms

Substances

LinkOut - more resources