

Overexpression of Rad in muscle worsens diet-induced insulin resistance and glucose intolerance and lowers plasma triglyceride level
- PMID: 16537411
- PMCID: PMC1450197
- DOI: 10.1073/pnas.0511246103
Overexpression of Rad in muscle worsens diet-induced insulin resistance and glucose intolerance and lowers plasma triglyceride level
Abstract
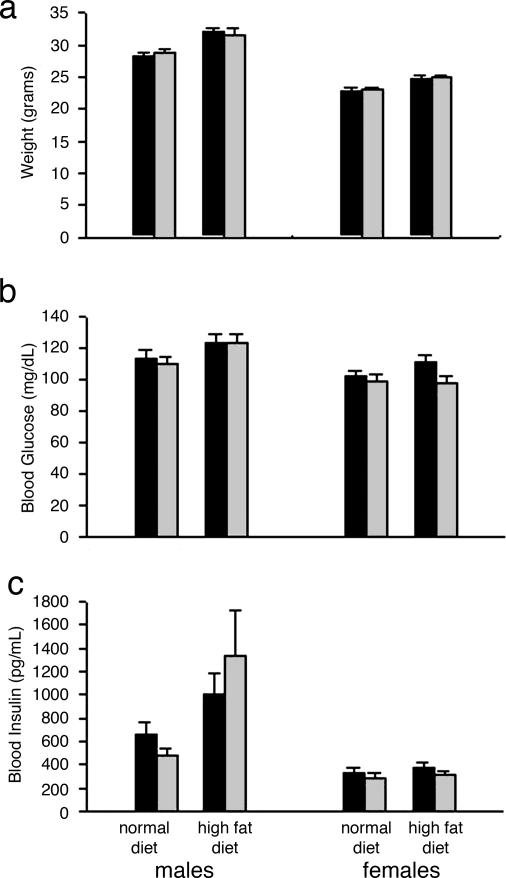
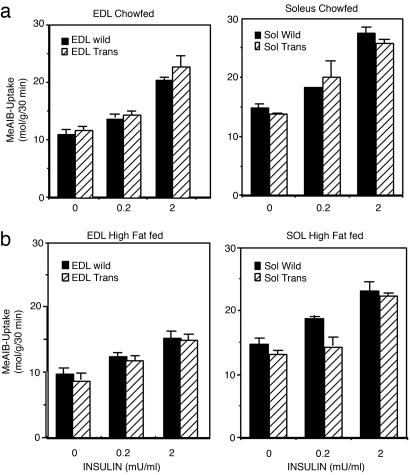
Rad is a low molecular weight GTPase that is overexpressed in skeletal muscle of some patients with type 2 diabetes mellitus and/or obesity. Overexpression of Rad in adipocytes and muscle cells in culture results in diminished insulin-stimulated glucose uptake. To further elucidate the potential role of Rad in vivo, we have generated transgenic (tg) mice that overexpress Rad in muscle using the muscle creatine kinase (MCK) promoter-enhancer. Rad tg mice have a 6- to 12-fold increase in Rad expression in muscle as compared to wild-type littermates. Rad tg mice grow normally and have normal glucose tolerance and insulin sensitivity, but have reduced plasma triglyceride levels. On a high-fat diet, Rad tg mice develop more severe glucose intolerance than the wild-type mice; this is due to increased insulin resistance in muscle, as exemplified by a rightward shift in the dose-response curve for insulin stimulated 2-deoxyglucose uptake. There is also a unexpected further reduction of the plasma triglyceride levels that is associated with increased levels of lipoprotein lipase in the Rad tg mice. These results demonstrate a potential synergistic interaction between increased expression of Rad and high-fat diet in creation of insulin resistance and altered lipid metabolism present in type 2 diabetes.
Conflict of interest statement
Conflict of interest statement: No conflicts declared.
Figures


Similar articles
-
High level overexpression of glucose transporter-4 driven by an adipose-specific promoter is maintained in transgenic mice on a high fat diet, but does not prevent impaired glucose tolerance.Endocrinology. 1995 Mar;136(3):995-1002. doi: 10.1210/endo.136.3.7867610. Endocrinology. 1995. PMID: 7867610
-
Prevention of diet-induced obesity in transgenic mice overexpressing skeletal muscle lipoprotein lipase.Am J Physiol. 1997 Aug;273(2 Pt 2):R683-9. doi: 10.1152/ajpregu.1997.273.2.R683. Am J Physiol. 1997. PMID: 9277555
-
Hormone-sensitive lipase knockout mice have increased hepatic insulin sensitivity and are protected from short-term diet-induced insulin resistance in skeletal muscle and heart.Am J Physiol Endocrinol Metab. 2005 Jul;289(1):E30-9. doi: 10.1152/ajpendo.00251.2004. Epub 2005 Feb 8. Am J Physiol Endocrinol Metab. 2005. PMID: 15701680
-
Metabolism and insulin signaling in common metabolic disorders and inherited insulin resistance.Dan Med J. 2014 Jul;61(7):B4890. Dan Med J. 2014. PMID: 25123125 Review.
-
Overexpression of muscle lipoprotein lipase and insulin sensitivity.Curr Opin Clin Nutr Metab Care. 2002 Sep;5(5):569-74. doi: 10.1097/00075197-200209000-00017. Curr Opin Clin Nutr Metab Care. 2002. PMID: 12172482 Review.
Cited by
-
Molecular profile and response to energy deficit of leptin-receptor neurons in the lateral hypothalamus.Sci Rep. 2022 Aug 4;12(1):13374. doi: 10.1038/s41598-022-16492-w. Sci Rep. 2022. PMID: 35927440 Free PMC article.
-
Into the spotlight: RGK proteins in skeletal muscle.Cell Calcium. 2021 Sep;98:102439. doi: 10.1016/j.ceca.2021.102439. Epub 2021 Jul 4. Cell Calcium. 2021. PMID: 34261001 Free PMC article. Review.
-
Human Lymph Node Stromal Cells Have the Machinery to Regulate Peripheral Tolerance during Health and Rheumatoid Arthritis.Int J Mol Sci. 2020 Aug 9;21(16):5713. doi: 10.3390/ijms21165713. Int J Mol Sci. 2020. PMID: 32784936 Free PMC article.
-
Genes, diet and type 2 diabetes mellitus: a review.Rev Diabet Stud. 2007 Spring;4(1):13-24. doi: 10.1900/RDS.2007.4.13. Epub 2007 May 10. Rev Diabet Stud. 2007. PMID: 17565412 Free PMC article.
-
Social regulation of insulin signaling and the evolution of eusociality in ants.Science. 2018 Jul 27;361(6400):398-402. doi: 10.1126/science.aar5723. Science. 2018. PMID: 30049879 Free PMC article.
References
-
- Reynet C., Kahn C. R. Science. 1993;262:1441–1444. - PubMed
-
- Moller D. E., Bjørbæk C., Vidal-Puig A. Diabetes Care. 1996;19:396–400. - PubMed
-
- Garvey W. T., Maianu L., Kennedy A., Wallace P., Ganaway E., Hamacher L. L., Yarnall D. P., Lenhard J. M., Burns D. K. Diabetes. 1997;46:444–450. - PubMed
-
- Paulik M. A., Hamacher L. L., Yarnall D. P., Simmons C. J., Maianu L., Pratley R. E., Garvey W. T., Burns D. K., Lenhard J. M. J. Cell Biochem. 1997;65:527–541. - PubMed
Publication types
MeSH terms
Substances
Grants and funding
LinkOut - more resources
Full Text Sources
Other Literature Sources
Medical
Molecular Biology Databases
Miscellaneous
