

Linkage analysis of quantitative traits for obesity, diabetes, hypertension, and dyslipidemia on the island of Kosrae, Federated States of Micronesia
- PMID: 16537441
- PMCID: PMC1533774
- DOI: 10.1073/pnas.0510156103
Linkage analysis of quantitative traits for obesity, diabetes, hypertension, and dyslipidemia on the island of Kosrae, Federated States of Micronesia
Abstract
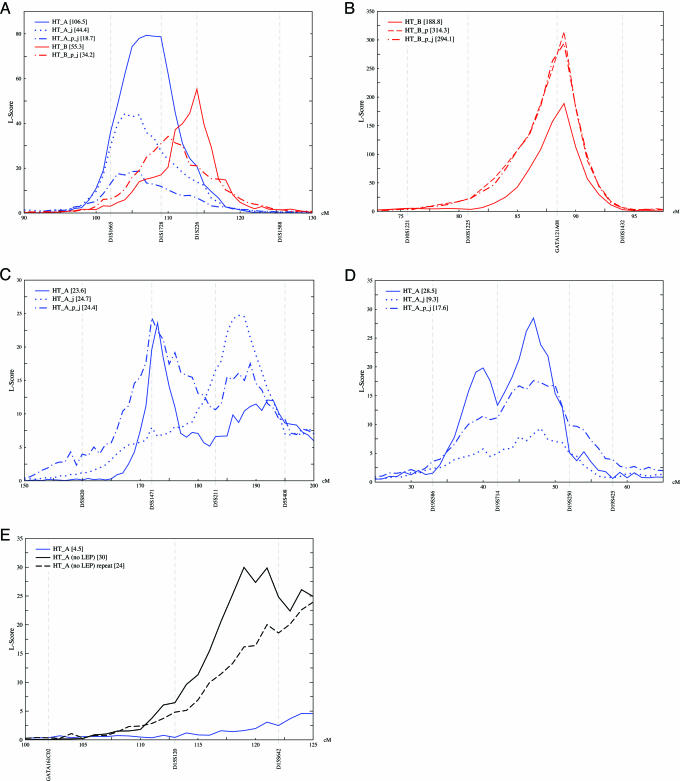
Obesity, diabetes, hypertension, and heart disease are highly heritable conditions that in aggregate are the major causes of morbidity and mortality in the developed world and are growing problems in developing countries. To map the causal genes, we conducted a population screen for these conditions on the Pacific Island of Kosrae. Family history and genetic data were used to construct a pedigree for the island. Analysis of the pedigree showed highly significant heritability for the metabolic traits under study. DNA samples from 2,188 participants were genotyped with 405 microsatellite markers with an average intermarker distance of 11 cM. A protocol using loki, a Markov chain Monte Carlo sampling method, was developed to analyze the Kosraen pedigree for height, a model quantitative trait. Robust quantitative trait loci for height were found on 10q21 and 1p31. This protocol was used to map a set of metabolic traits, including plasma leptin to chromosome region 5q35; systolic blood pressure to 20p12; total cholesterol to 19p13, 12q24, and 16qter; hip circumference to 10q25 and 4q23; body mass index to 18p11 and 20q13; apolipoprotein B to 2p24-25; weight to 18q21; and fasting blood sugar to 1q31-1q43. Several of these same chromosomal regions have been identified in previous studies validating the use of loki. These studies add information about the genetics of the metabolic syndrome and establish an analytical approach for linkage analysis of complex pedigrees. These results also lay the foundation for whole genome scans with dense sets of SNPs aimed to identifying causal genes.
Conflict of interest statement
Conflict of interest statement: No conflicts declared.
Figures

References
Publication types
MeSH terms
Grants and funding
LinkOut - more resources
Full Text Sources
Other Literature Sources
Medical
