. 2006 Mar 7;103(10):3639-44.
doi: 10.1073/pnas.0600092103. Epub 2006 Feb 28.

Neutrophil polarization: spatiotemporal dynamics of RhoA activity support a self-organizing mechanism

Affiliations

Neutrophil polarization: spatiotemporal dynamics of RhoA activity support a self-organizing mechanism

Kit Wong et al. Proc Natl Acad Sci U S A. .

Abstract

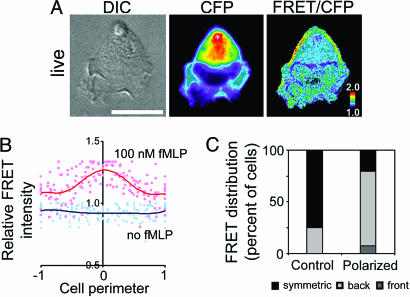
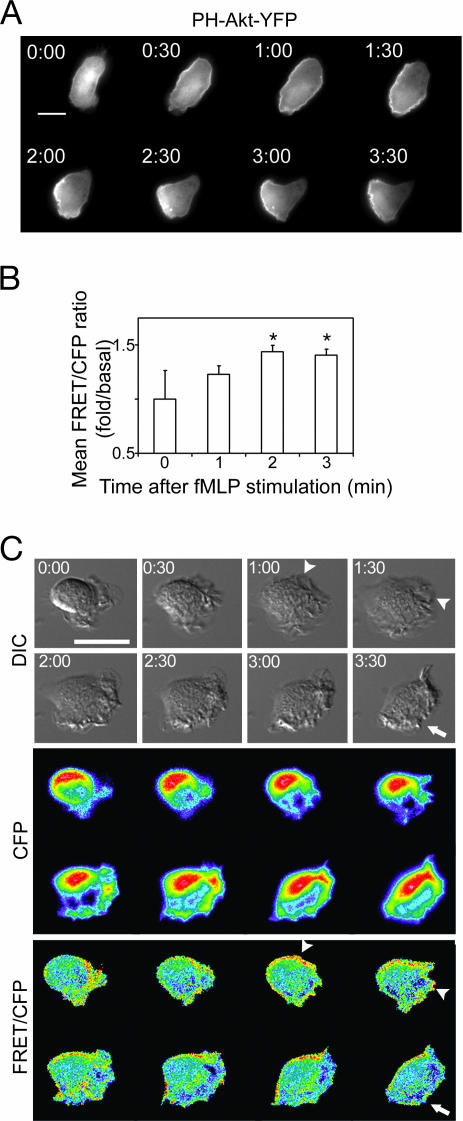
Chemoattractants like fMet-Leu-Phe (fMLP) induce neutrophils to polarize with phosphatidylinositol 3,4,5-trisphosphate (PIP3) and protrusive F-actin at the front and actomyosin contraction at the sides and back. RhoA and its downstream effector, myosin II, mediate the "backness" response, which locally inhibits the "frontness" response and constrains its location to one part of the cell. In living HL-60 cells, we used a fluorescent PIP3 probe or a single-chain FRET biosensor for RhoA-GTP to assess spatial distribution of frontness or backness responses, respectively, during the first 3 min after exposure to a uniform concentration of fMLP. Increased PIP3 signal or RhoA activity initially localized randomly about the cell's periphery but progressively redistributed to the front or to the back and sides, respectively. Cells rendered unable to mount the frontness response (by inhibiting actin polymerization or Gi, a trimeric G protein) responded to a micropipette source of attractant by localizing RhoA activity at the up-gradient edge. We infer that protrusive F-actin, induced by the frontness response, constrains the spatial distribution of backness by locally reducing activation of RhoA, thereby reducing its active form at the front. Mutual incompatibility of frontness and backness is responsible for self-organization of neutrophil polarity.


Conflict of interest statement

Conflict of interest statement: K.H. is a paid consultant of Genospectra (Fremont, CA).

Figures

Fig. 1.
Fig. 1.
Characterization of the RhoA biosensor. (A) Distribution of the RhoA biosensor and FRET/CFP in a live polarized dHL-60 cell. CFP and FRET/CFP ratio images are in pseudocolor, with the color indicating the relative value at each pixel. (Scale bar, 10 μm.) (B) Distributions of relative FRET/CFP intensities at the peripheries of 10 unstimulated cells (blue) or 10 cells treated with 100 nM fMLP (red). Peripheral FRET/CFP ratios, assessed as described in Materials and Methods, were significantly increased at the back of stimulated cells. The maximum peripheral FRET/CFP value for stimulated cells is 1.3, reflecting ≈30% greater peripheral FRET/CFP of stimulated cells. Values at the back (origins) of fMLP-treated cells were significantly greater (P < 0.0001) than those at the cell’s front (midpoint), whereas values at the origin and midpoint of unstimulated cells were not different (P = 0.38). Similarly, as indicated by the red and blue regression lines, mean FRET/CFP at the back of stimulated cells was significantly greater (P < 0.0001) than that at the origin of unstimulated cells. Fig. 6 shows how peripheral pixels were identified and analyzed (see also Materials and Methods), as well as pseudocolor images of representative unstimulated or stimulated cells and plots of the corresponding peripheral FRET/CFP values. (C) Relative numbers of cells with asymmetric (gray) or symmetric (black) FRET/CFP distribution in fixed unstimulated cells (n = 72) vs. cells (n = 69) polarized after a 3-min stimulation with 100 nM fMLP. Polarized cells showing asymmetric FRET/CFP distribution are further categorized into front (dark gray) vs. back (light gray) localization.
Fig. 2.
Fig. 2.
Accumulation and localization of PIP3 and RhoA-GTP during dHL-60 cell polarization. (A) Time-lapse microscopy of PH-Akt-YFP recruitment in a live dHL-60 cell. A uniform concentration of fMLP (100 nM) was added at time 0, and fluorescent images of the same cell are shown at the indicated times. (Scale bar, 5 μm.) PH-Akt-YFP translocated from cytoplasm to almost the entire periphery of the cell at 30–60 s and then localized to a clearly demarcated pseudopod at one end of the cell. Similar patterns and timing of these changes were seen in all 10 PH-Akt-YFP-expressing cells tested (data not shown). (B) RhoA biosensor cells were stimulated with 100 nM fMLP for the indicated times, fixed, and imaged for FRET/CFP analysis. fMLP increased the average FRET/CFP ratios, assessed over the footprint of each individual cell, at 2 and 3 min (P ≤ 0.05); the increase at 1 min was not statistically significant (P = 0.3). Data were normalized to the basal FRET/CFP ratio at 0 min (1.0). Shown are representative resu1ts from three individual experiments, each with n ≥ 25 in each condition. Error bars are +2 SEM. (C) Time-lapse microscopy of live dHL-60 cells expressing the RhoA biosensor. Images represent an individual cell before the addition of 100 nM fMLP (time 0) and every 30 s thereafter. Top, Middle, and Bottom represent DIC, CFP, and FRET/CFP ratio images, respectively. Arrows point to ruffles with a low FRET/CFP signal in the front of polarized cells, whereas arrowheads indicate areas that showed both ruffles and high FRET signals before the cell completed morphological polarization. Each image was scaled according to its high and low values at each time point to show relative distributions of RhoA activities at each time point. The dynamic range was 1.5–2.3. Warmer colors correspond to higher values. (Scale bars, 10 μm.)
Fig. 3.
Fig. 3.
Effects of inhibiting Gi on RhoA activity. (A) Control or PTX-treated (1 μg/ml; 18 h) RhoA biosensor cells with or without fMLP stimulation (100 nM; 3 min) were fixed and subjected to FRET/CFP imaging. Representative DIC and FRET/CFP ratio images are shown. FRET/CFP images of control and PTX-treated cells were scaled individually and represented in pseudocolor. (Scale bar, 10 μm.) (B) Representative control or PTX-treated RhoA biosensor cells were stimulated with 100 nM fMLP for 3 min and fixed and stained for F-actin by using Alexa Fluor 647/phalloidin. Shown are DIC and the corresponding fluorescence images. (C) RhoA biosensor cells with or without PTX pretreatment were exposed to an fMLP gradient. An asterisk depicts the orientation of an fMLP gradient generated by a micropipette. DIC and FRET/CFP ratio images of representative cells are shown. A warm color represents a high value; a cold color represents a low value. (Scale bar, 10 μm.) (D) FRET/CFP distributions away, toward, or irrespective to the micropipette were categorized as down-gradient, up-gradient, or other, respectively, and the percentage of cells in each group was quantified. The numeral above each bar indicates the number of cells showing the distribution indicated. Distribution was determined as described in Materials and Methods.
Fig. 4.
Fig. 4.
Actin polymerization restricts the distribution of active RhoA. (A) Quantitation of average FRET/CFP ratios in control or latrunculin B-treated (LatB; 20 μg/ml; 10 min) RhoA biosensor cells with or without fMLP stimulation (100 nM; 3 min). Data were obtained from >25 cells for each condition and were normalized to the FRET/CFP level of unstimulated controls (1.0). Similar results were observed in three independent experiments. Error bars show + 2 SEM. Asterisks indicate statistical significances of the differences (∗, P < 0.05; ∗∗, P < 0.001) from control cells not treated with fMLP (Student’s t test). Cells pretreated with latrunculin B showed no statistically significant effect of further stimulation with fMLP (P ≥ 0.3). (B) RhoA biosensor cells treated with LatB (20 μg/ml) for 5 min were subjected to an fMLP gradient generated by a micropipette filled with 10 μM fMLP. Shown are DIC and FRET/CFP images of a representative cell before and after the lowering of a micropipette or of a representative cell treated with uniform fMLP (100 nM) for 3 min and fixed. Each ratio image was scaled independently according to its high and low values to show relative distributions of RhoA activities. (Scale bar, 5 μm.) A warm color represents a high value; a cold color represents a low value. (C) Plots of relative RhoA FRET/CFP level along the peripheries of the cells shown in B. The origin of these peripheral measurements, marked as “0” in B, has a value of 0 on the abscissa, in which the diametrically opposite region of the periphery corresponds to −1 or +1. The origins are either arbitrary (untreated cell and cells treated with uniform fMLP) or indicate the orientation of the micropipette. Each data point was normalized by the maximum (1.0) for both axes (see Materials and Methods). (D) Number of LatB-treated cells that fell into down-gradient, up-gradient, or other categories. Ninety percent of control cells (9 of 10) showed high FRET/CFP at the back (away from the pipette), whereas 3 of 13 LatB-treated cells (23%) showed down-gradient localization (see Materials and Methods).

Similar articles

Cited by

References

    1. Servant G., Weiner O. D., Herzmark P., Balla T., Sedat J. W., Bourne H. R. Science. 2000;287:1037–1040. - PMC - PubMed
    1. Hauert A. B., Martinelli S., Marone C., Niggli V. Int. J. Biochem. Cell Biol. 2002;34:838–854. - PubMed
    1. Merlot S., Firtel R. A. J. Cell Sci. 2003;116:3471–3478. - PubMed
    1. Chung C. Y., Funamoto S., Firtel R. A. Trends Biochem. Sci. 2001;26:557–566. - PubMed
    1. Raftopoulou M., Hall A. Dev. Biol. 2004;265:23–32. - PubMed

Publication types