. 2006 Mar 7;103(10):3828-33.
doi: 10.1073/pnas.0511323103. Epub 2006 Feb 28.

Quorum sensing and motility mediate interactions between Pseudomonas aeruginosa and Agrobacterium tumefaciens in biofilm cocultures

Affiliations

Quorum sensing and motility mediate interactions between Pseudomonas aeruginosa and Agrobacterium tumefaciens in biofilm cocultures

Dingding An et al. Proc Natl Acad Sci U S A. .

Abstract

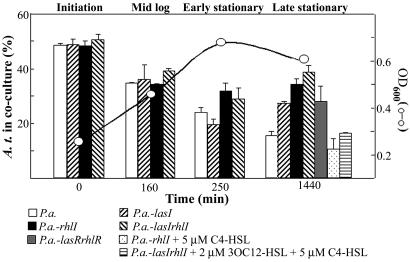
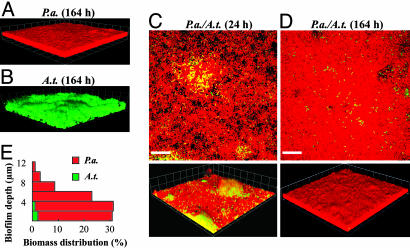
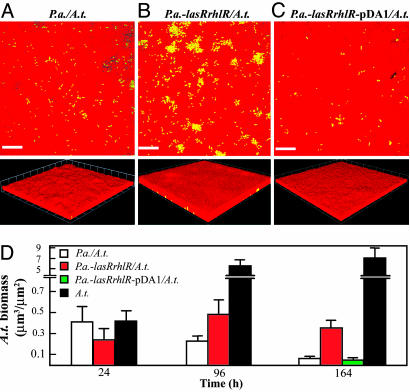
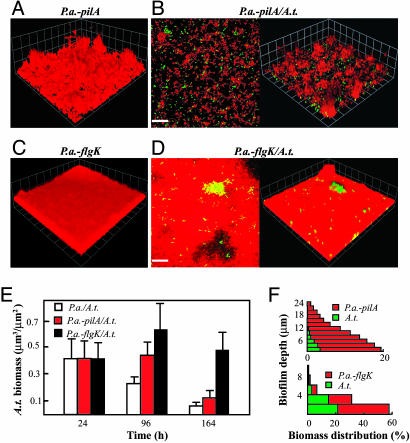
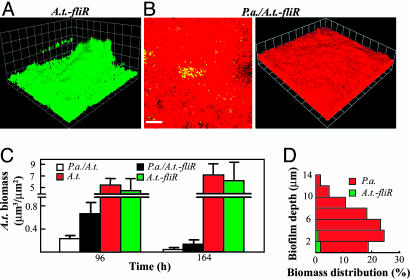
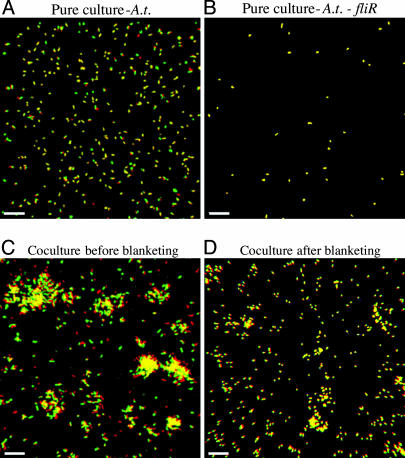
In the environment, multiple microbial taxa typically coexist as communities, competing for resources and, often, physically associated within biofilms. A dual-species cocultivation model has been developed by using two ubiquitous and well studied microbes Pseudomonas aeruginosa (P.a.) and Agrobacterium tumefaciens (A.t.) as a tractable system to identify molecular mechanisms that underlie multispecies microbial associations. Several factors were found to influence coculture interactions. P.a. had a distinct growth-rate advantage in cocultures, increasing its relative abundance during planktonic and biofilm growth. P.a. also demonstrated a slight quorum-sensing-dependent increase in growth yield in liquid cocultures. P.a. dominated coculture biofilms, "blanketing" or burying immature A.t. microcolonies. P.a. flagellar and type IV pili mutant strains exhibited deficient blanketing and impaired competition in coculture biofilms, whereas, in planktonic coculture, these mutations had no effect on competition. In contrast, A.t. used motility to emigrate from coculture biofilms. In both planktonic and biofilm cocultures, A.t. remained viable for extended periods of time, coexisting with its more numerous competitor. These findings reveal that quorum-sensing-regulated functions and surface motility are important microbial competition factors for P.a. and that the outcome of competition and the relative contribution of different factors to competition are strongly influenced by the environment in which they occur.


Conflict of interest statement

Conflict of interest statement: No conflicts declared.

Figures

Fig. 1.
Fig. 1.
Planktonic cocultures. Population dynamics of wild-type, mutant, and complemented mutant cocultures inoculated at a 1:1 ratio. Displayed on the y axis (at the left) is the percentage of A.t. present in the culture at four different points of the growth curve. Standard deviation of three replicates is indicated. Open circles indicate the OD600 (at the right) of a representative growth curve at which a coculture sample was assayed. All coculture growth curves were nearly identical (data not shown). Quorum-sensing mutant strains were complemented by the exogenous addition of the indicated amount of purified acyl-HSLs.
Fig. 2.
Fig. 2.
P.a. blankets A.t. in coculture biofilms. (A and B) Three-dimensional views of P.a. and A.t. wild-type pure-culture flow-cell biofilms. (C and D) Coculture biofilms at 24 and 164 h after inoculation. (Top) An xy slice close to the attachment surface. (Bottom) Three-dimensional views. Red cells, P.a., green cells, A.t. (Scale bars, 20 μm; 1 unit in 3D view = 13.4 μm.) (E) A quantitative determination of biomass distributions along biofilm depth in a coculture biofilm at 96 h.
Fig. 3.
Fig. 3.
Quorum sensing provides an advantage to P.a. in coculture biofilms. (AC Top) An xy slice close to the attachment surface. (A–C Bottom) Three-dimensional views. (A) A coculture biofilm of wild-type P.a. and A.t. (B) A coculture biofilm of P.a.-lasRrhlR and wild-type A.t. (C) A coculture biofilm of P.a.-lasRrhlR complemented with pDA1 and wild-type A.t. Red cells, P.a., green cells, A.t. (Scale bars, 20 μm; 1 unit in 3D view = 13.4 μm.) All micrographs were taken at 164 h. (D) comstat determination of the relative amount of A.t. biofilm biomass present in pure and coculture biofilms.
Fig. 4.
Fig. 4.
P.a. motility is required for blanketing. (A and C) Three-dimensional views of a P.a.-pilA (A) and P.a.-flgK (C) pure-culture biofilms. (B and D) xy slices close to the attachment surface and 3D views of a P.a.-pilA/A.t. (B) and P.a.-flgK/A.t. (D) Coculture biofilms. Red cells, P.a.; green cells, A.t. (Scale bars, 20 μm; 1 unit in 3D view, 13.4 μm.) All micrographs were taken at 164 h. (E) comstat determination of the relative amount of A.t. biofilm biomass present in cocultures. (F) A quantitative determination of biomass distributions along biofilm depth in P.a.-pilA/A.t. and P.a.-flgK/A.t. coculture biofilms at 96 h.
Fig. 5.
Fig. 5.
Biofilm coculture phenotypes of an A.t.-fliR mutant strain. (A) A 3D-view of an A.t.-fliR pure-culture biofilm; (B) An xy slice close to attachment surface and a 3D-view of a P.a./A.t.-fliR coculture biofilm; Red cells, P.a; green cells, A.t. (Scale bars, 20 μm; 1 unit in 3D view, 13.4 μm.) All micrographs were taken at 164 h. (C) comstat determination of the relative amount of A.t. biofilm biomass present in pure cultures and cocultures. (D) A quantitative determination of biomass distributions along biofilm depth in a P.a./A.t.-fliR. coculture biofilm at 96 h.
Fig. 6.
Fig. 6.
Different biofilm time-lapse microscopy series. Yellow cells indicate bacteria that have not moved during the course of the time series. Green cells indicate bacteria that were present in the field of view at the beginning of the time course but not at the end. Red cells are bacteria present at the end of the time series that were not present at the start. (A and B) A 1-h time course of a newly inoculated pure-culture biofilm of wild-type A.t. (A) or A.t.-fliR (B). (Scale bar, 12 μm.) (C and D) A time course of wild-type A.t. in coculture with P.a. (P.a. cells are not visible). (C) A 3-h time course before blanketing has occurred. (D) A 3-h time course after complete blanketing has occurred. (Scale bar, 20.2 μm.)

References

    1. Tilman D. Proc. Natl. Acad. Sci. USA. 2004;101:10854–10861. - PMC - PubMed
    1. Smith V. H. Antonie Leeuwenhoek. 2002;81:99–106. - PubMed
    1. Taga M. E., Bassler B. L. Proc. Natl. Acad. Sci. USA. 2003;100:14549–14554. - PMC - PubMed
    1. Riedel K., Hentzer M., Geisenberger O., Huber B., Steidle A., Wu H., Hoiby N., Givskov M., Molin S., Eberl L. Microbiology. 2001;147:3249–3262. - PubMed
    1. Moller S., Sternberg C., Andersen J. B., Christensen B. B., Ramos J. L., Givskov M., Molin S. Appl. Environ. Microbiol. 1998;64:721–732. - PMC - PubMed

Publication types

MeSH terms