Comparative Study
. 2006 Mar 14;103(11):4011-6.
doi: 10.1073/pnas.0510921103. Epub 2006 Mar 7.

Severe acute respiratory syndrome diagnostics using a coronavirus protein microarray

Affiliations
Comparative Study

Severe acute respiratory syndrome diagnostics using a coronavirus protein microarray

Heng Zhu et al. Proc Natl Acad Sci U S A. .

Abstract

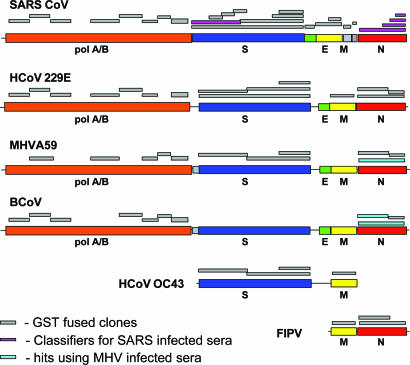
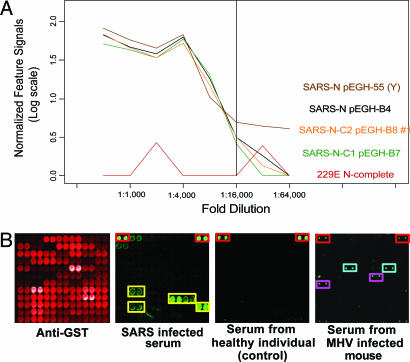
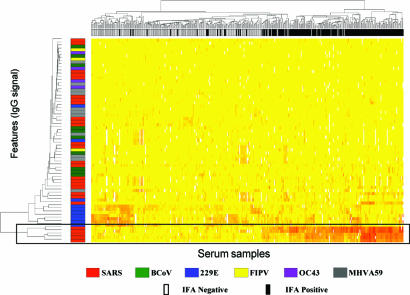
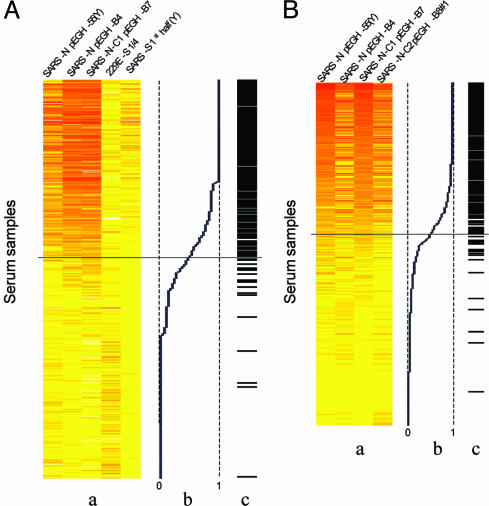
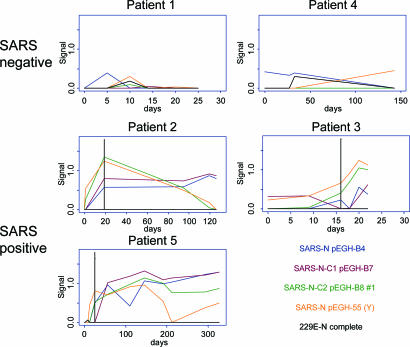
To monitor severe acute respiratory syndrome (SARS) infection, a coronavirus protein microarray that harbors proteins from SARS coronavirus (SARS-CoV) and five additional coronaviruses was constructed. These microarrays were used to screen approximately 400 Canadian sera from the SARS outbreak, including samples from confirmed SARS-CoV cases, respiratory illness patients, and healthcare professionals. A computer algorithm that uses multiple classifiers to predict samples from SARS patients was developed and used to predict 206 sera from Chinese fever patients. The test assigned patients into two distinct groups: those with antibodies to SARS-CoV and those without. The microarray also identified patients with sera reactive against other coronavirus proteins. Our results correlated well with an indirect immunofluorescence test and demonstrated that viral infection can be monitored for many months after infection. We show that protein microarrays can serve as a rapid, sensitive, and simple tool for large-scale identification of viral-specific antibodies in sera.


Conflict of interest statement

Conflict of interest statement: M.S. consults for Invitrogen.

Figures

Fig. 1.
Fig. 1.
Regions of six coronaviruses represented on the microarray. The positions of the cloned and expressed fragments are marked with light-gray bars. The pink bars represent SARS features selected as classifiers in the supervised cluster analysis (both k-NN and LR). The light-blue bars are features bound by the MHVA59-infected mouse serum.
Fig. 2.
Fig. 2.
Analysis of patient serum samples in a protein microarray format. (A) A SARS-CoV-positive serum from a diagnosed SARS-CoV-infected patient in Beijing was tested at eight dilutions. The signals for the five SARS N protein fragments are shown on the chart. The vertical line indicates the detection limit. (B) Examples of coronavirus protein microarrays probed with various sera from SARS-CoV-infected or uninfected individuals. The first image shows probing with an anti-GST antibody. The second image shows probing with a serum from a SARS patient. The N protein and its fragments were the most antigenic protein on the array [indicated by the yellow boxes (second image)]. The third image shows probing with a serum from a non-SARS patient. The fourth image shows probing with a serum from MHVA59-infected mouse. Light-blue boxes, the MHV N protein; pink boxes, the BCoV N protein. The red boxes indicate the signals from the human IgG used as the positive controls.
Fig. 3.
Fig. 3.
Unsupervised 2D clustering of the Toronto sera and microarray features. The 399 Toronto IgG sera were clustered according to their reactivity to the microarray signals, and the microarray features were clustered according to their serum reactivity. The corresponding Euroimmun IIFT SARS-CoV IgG results are indicated on top of the diagram, where black and white bars represent SARS-positive and -negative sera, respectively. The different coronaviruses are color-coded on the left of the diagram. The yellow color is low or background signal on the arrays, whereas the orange color represents signals above the background level. The black box highlights the features that help classify SARS-infected sera from the microarray assays. All of the classifiers in the black rectangle are SARS N proteins and SARS N fragments.
Fig. 4.
Fig. 4.
Models generated by k-NN (A) and LR (B). The cutoff for the prediction is the probability of 0.5, which is indicated by the black horizontal line: (lane a) signals for the selected classifiers, (lane b) confidence calculated from the classifier signals (range from 0 to 1), and (lane c) the IIFT annotations, where the black and white boxes represent IIFT-positive and -negative, respectively. On the top are depicted the names of the features that were selected by the k-NN and LR models.
Fig. 5.
Fig. 5.
Time-course analysis of serum reactivity of five Canadian individuals. (Top) Graphs from two individuals with non-SARS respiratory disease; (Bottom) Results from three SARS patients. The relative levels of antibodies against four of the SARS N protein constructs along with that of HCoV-229E N protein were monitored at different times. The vertical lines indicate the time at which the individuals were diagnosed as SARS-positive by biochemical assays.

References

    1. Donnelly C. A., Ghani A. C., Leung G. M., Hedley A. J., Fraser C., Riley S., Abu-Raddad L. J., Ho L. M., Thach T. Q., Chau P., et al. Lancet. 2003;361:1761–1766. - PMC - PubMed
    1. McIntosh K., Chao R. K., Krause H. E., Wasil R., Mocega H. E., Mufson M. A. J. Infect. Dis. 1974;130:502–507. - PMC - PubMed
    1. Rainer T. H., Cameron P. A., Smit D., Ong K. L., Hung A. N. W., Nin D. C. P., Ahuja A. T., Si L. C. Y., Sung J. J. Y. Br. Med. J. 2003;326:1354–1358. - PMC - PubMed
    1. Bressler A. M., Nolte F. S. J. Clin. Microbiol. 2004;42:987–991. - PMC - PubMed
    1. Peiris J. S., Chu C. M., Cheng V. C., Chan K. S., Hung I. F., Poon L. L., Law K. I., Tang B. S., Hon T. Y., Chan C. S., et al. Lancet. 2003;361:1767–1772. - PMC - PubMed

Publication types

MeSH terms

LinkOut - more resources