. 2006 Mar 14;103(11):4305-10.
doi: 10.1073/pnas.0509324103. Epub 2006 Mar 6.

Orphaned ryanodine receptors in the failing heart

Affiliations

Orphaned ryanodine receptors in the failing heart

Long-Sheng Song et al. Proc Natl Acad Sci U S A. .

Abstract

Heart muscle is characterized by a regular array of proteins and structures that form a repeating functional unit identified as the sarcomere. This regular structure enables tight coupling between electrical activity and Ca(2+) signaling. In heart failure, multiple cellular defects develop, including reduced contractility, altered Ca(2+) signaling, and arrhythmias; however, the underlying causes of these defects are not well understood. Here, in ventricular myocytes from spontaneously hypertensive rats that develop heart failure, we identify fundamental changes in Ca(2+) signaling that are related to restructuring of the spatial organization of the cells. Myocytes display both a reduced ability to trigger sarcoplasmic reticulum Ca(2+) release and increased spatial dispersion of the transverse tubules (TTs). Remodeled TTs in cells from failing hearts no longer exist in the regularly organized structures found in normal heart cells, instead moving within the sarcomere away from the Z-line structures and leaving behind the sarcoplasmic reticulum Ca(2+) release channels, the ryanodine receptors (RyRs). These orphaned RyRs appear to be responsible for the dyssynchronous Ca(2+) sparks that have been linked to blunted contractility and, probably, Ca(2+)-dependent arrhythmias in diverse models of heart failure. We conclude that the increased spatial dispersion of the TTs and orphaned RyRs lead to the loss of local control and Ca(2+) instability in heart failure.


Conflict of interest statement

Conflict of interest statement: No conflicts declared.

Figures
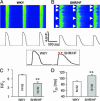
Fig. 1.
Fig. 1.
Ca2+ signaling in normal and failing ventricular myocytes. (A) A 1-Hz train of field stimulated [Ca2+]i transients is shown as line-scan images from a fluo-4-loaded control cell from Wistar-Kyoto (WKY) rats (Upper) and fluorescence records (Lower). (B) A train of stimulated [Ca2+]i transients for age-matched spontaneously hypertensive rats with heart failure (SHR/HF). White arrows mark the positions on line-scan images in which [Ca2+]i releases are missing at fixed locations in consecutive beats within the same cell. Late or dyssynchronous Ca2+ release events were revealed after initial missing releases. (Inset) WKY and SHR/HF Ca2+ transients on expanded time scale. Red arrowed line denotes prolonged Ca2+ release in the failing myocyte. (C) Reduced amplitude of [Ca2+]i transient (F/F0) in SHR/HF cells. (D) Prolonged [Ca2+]i transient in SHR/HF cells. n = 30–52 cells from four to six hearts. ∗∗, P < 0.01 vs. WKY cells. T20, the plateau duration measured at 20% below the peak level.
Fig. 2.
Fig. 2.
Defective local EC coupling in SHR failing myocytes. (A) Ca2+ spikes shown in control cells (WKY). Local EC coupling and SR Ca2+ release function was examined by using Ca2+ spikes method (31, 32). Briefly, EGTA (4 mM) was added to the pipette-filling solution to limit the diffusion of released Ca2+. The local Ca2+ release signal was detected with the Ca2+ indicator (1 mM Oregon Green 488 BAPTA-5N). Local signals with ΔF/F0 > 4 SD were considered spike events. (B) Ca2+ spikes from SHR/HF cells. White arrows mark the missed events at the potential release sites. (C) Time course of local Ca2+ release at sites 1–8 for control and HF cells. (D) The spatially averaged SR Ca2+ release flux (Jsr) was decreased in SHR/HF (ANOVA, P < 0.01 vs. WKY group over the voltage range, n = 11–15 cells from approximately four to five hearts). (E) Ca2+ spike latency as a function of test voltage. Spike latency was measured from the beginning of the depolarizing pulse to the take-off (2 SD above baseline) of Ca2+ spike. (F) Fractional TT-SR activation: percentage of activated TT-SR junctions to total junctions measured. (ANOVA, P < 0.01 vs. WKY group over the voltage range, n = 11–15 cells from four to five hearts).
Fig. 3.
Fig. 3.
Alterations in transverse tubule morphology in failing rat ventricular myocytes. (A) Control myocytes from WKY rats were exposed to 10 μM of the fluorescent lipophilic marker Di-8-ANEPPS for 10 min, and imaged with a confocal microscope. (B) Myocytes from an age-matched SHR/HF rat were imaged as in A. (C) Zoomed-in view (×2.5) of A with high-contrast color look-up table. (D) Zoomed-in view of B. (E) TT line tracing from C. (F) TT line tracing from D. (G) Power versus spatial frequency in the longitudinal (x) dimension, at zero frequency in the y dimension, computed by using Fourier analysis (see Materials and Methods). Failing myocytes display a clear decrease in power at ≈0.5 μm−1, which corresponds to the average TT spacing of 2 μm seen in healthy cells. The 2nd and 3rd harmonic components seen in WKY are almost completely absent in the SHR/HF cells, consistent with the chaotic appearance of TT in the HF cell. (H and I) Density of LEs (H) and TEs (I). Bars represent the percentage of cell pixels positive for Di-8-ANEPPS staining that were part of a continuous line of stained pixels extending for at least 2 μm in either the longitudinal (H) or the transverse (I) direction. See Materials and Methods for a description of the normalization and thresholding steps involved in computing these percentages. ∗∗∗, P < 0.001 vs. WKY controls, n = 9–13 cells from four hearts.
Fig. 4.
Fig. 4.
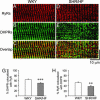
Reorganization of EC coupling proteins in failing ventricular myocytes: Orphaned RyRs. (A) Immunofluorescence image of a WKY cell for RyRs (red). (B) Coimmunofluorescence image (with A above) for DHPRs (green). (C) Colocalization image for A and B. (DF) As in AC for SHR/HF cell. (G) 2D protein colocalization analysis was achieved by using unbiased automatic thresholding methods (see Materials and Methods). The percentage of DHPRs colocalized with RyRs was reduced in HF. (H) Measurement of colocalization of RyRs with DHPRs. ∗∗, P < 0.01; ∗∗∗, P < 0.001 vs. WKY, n = 15 and 10 cells for WKY and SHR/HF, respectively.

References

    1. Cheng H., Lederer W. J., Cannell M. B. Science. 1993;262:740–744. - PubMed
    1. Lopez-Lopez J. R., Shacklock P. S., Balke C. W., Wier W. G. Science. 1995;268:1042–1045. - PubMed
    1. Cannell M. B., Cheng H., Lederer W. J. Science. 1995;268:1045–1050. - PubMed
    1. Cheng H., Cannell M. B., Lederer W. J. Pflügers Arch. 1994;428:415–417. - PubMed
    1. Shacklock P. S., Wier W. G., Balke C. W. J. Physiol. (London) 1995;487:601–608. - PMC - PubMed

Publication types

Substances