. 2006 Jul 1;108(1):253-61.
doi: 10.1182/blood-2005-11-4567. Epub 2006 Mar 14.

TNF downmodulates the function of human CD4+CD25hi T-regulatory cells

Affiliations

TNF downmodulates the function of human CD4+CD25hi T-regulatory cells

Xavier Valencia et al. Blood. .

Abstract

CD4+CD25+ T-regulatory cells (Tregs) play an essential role in maintaining immunologic homeostasis and preventing autoimmunity. However, little is known about the exogenous factors that regulate their differentiation and function. Here, we report that TNF inhibits the suppressive function of both naturally occurring CD4+CD25+ Tregs and TGFbeta1-induced CD4+CD25+ T-regulatory cells. The mechanism of this inhibition involves signaling through TNFRII that is constitutively expressed selectively on unstimulated Tregs and that is up-regulated by TNF. TNF-mediated inhibition of suppressive function is related to a decrease in FoxP3 mRNA and protein expression by the Tregs. Notably, CD4+CD25hi Tregs isolated from patients with active rheumatoid arthritis (RA) expressed reduced levels of FoxP3 mRNA and protein and poorly suppressed the proliferation and cytokine secretion of CD4+ effector T cells in vitro. Treatment with anti-TNF antibody (infliximab) increased FOXP3 mRNA and protein expression by CD4+CD25hi Tregs and restored their suppressive function. Thus, TNF has a novel action in modulating autoimmunity, by inhibiting CD4+CD25+ Treg activity.


Figures
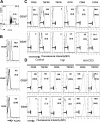
Figure 1.
Figure 1.
Phenotype of CD4+CD25hi Tregs. (A) Purified CD4+ T cells from healthy donors were stained with anti-CD4 Cychrome and anti-CD25 PE, and the population was sorted into CD4+CD25- and CD4+CD25hi subsets as indicated in “Patients, materials, and methods.” The resultant purity of CD4+CD25hi and CD4+CD25- T cells is shown in panel C. (B) FoxP3 expression is restricted to the CD4+CD25hi Treg population. Freshly sorted CD4+CD25hi Tregs and CD4+CD25int and CD4+CD25- effector cells were isolated, and their expression of FoxP3 was characterized by intracellular staining with anti-FoxP3-APC. Data shown are representative of 3 different experiments. The isotype staining control is shown in the dotted line and the staining for FoxP3, in black. Numbers in each histogram indicate the percentage of positive cells and those in parentheses, the mean fluorescence intensity of staining. (C) Purified populations were stained with anti-TNFRI-FITC-, anti-TNFRII-APC-, anti-GITR-FITC-, anti-CD69L-FITC-, and anti-CCR4-APC-conjugated mAb. The gates were set using isotype control antibodies. Staining with the isotype-matched control mAb is indicated by the horizontal bracket. Data are representative of results from more than 10 different experiments. Numbers in each histogram indicate the percentage of positive cells and those in parentheses, the mean fluorescence intensity of staining. (D) TNF up-regulates expression of TNFRII on CD4+CD25hi T cells. Freshly sorted CD4+CD25hi T-regulatory cells and CD4+CD25- effector cells were incubated overnight with TNF at 50 ng/mL-1 or stimulated with immobilized anti-CD3, and their expression of CD25 and TNFRII was characterized. Numbers in each box indicate the percentage of positive cells and those in parentheses, the mean fluorescence intensity of staining.
Figure 2.
Figure 2.
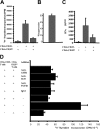
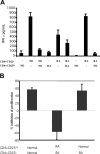
Human CD4+CD25hi T cells suppress proliferation and IFNγ production of CD4+CD25- T cells. CD4+CD25- responders (5 × 10⁴/well) and CD4+CD25hi Tregs (5 × 10⁴/well) were cultured with plate-bound anti-CD3 (1 μg/well) either alone or at a 1:1 ratio. (A) After 72 hours, 3H-thymidine incorporation was determined. Results are the mean ± SEM of 40 separate experiments using individual donors. (B) The percent inhibition of proliferation of these 40 experiments. Data are shown as means ± SEM. (C) Culture supernatants were diluted and analyzed to determine the amount of interferon γ. Data represent the mean ± SE of triplicate cultures and are expressed as nanogram per milliliter. (D) The suppressive activity of human CD4+CD25hi Tregs is independent of TGFβ1, IL-10, or GITR. CD4+CD25- T cells (5 × 10⁴/well) or CD4+CD25hi Tregs (5 × 10⁴/well) either alone or mixed together at a ratio of 1:1 were stimulated with plate-bound anti-CD3 (1 μg/well). Neutralizing antibodies against TGFβ1 (2 μg/well), IL-10 (2 μg/well), or anti-GITR (0.2 μg/well) were added as indicated. 3H-thymidine incorporation was determined after 72 hours and the data shown are the mean ± SEM of 3 independent experiments.
Figure 3.
Figure 3.
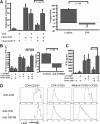
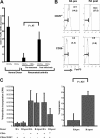
Suppressive property of CD4+CD25hi Tregs is abrogated by TNF. (A) CD4+CD25- T cells (5 × 10⁴/well) or CD4+CD25hi Tregs (5 × 10⁴/well) alone or mixed together at a ratio of 1:1 were stimulated with plate-bound anti-CD3 (1 μg/well). Recombinant TNF was added at the beginning of the culture at 50 ng/mL as indicated. After 72 hours, 3H-thymidine incorporation was determined. Data are the mean ± SEM of 6 independent experiments. (B) TNFRII cross-linking reverses the CD4+CD25hi Treg-mediated suppression of the proliferation of CD4+CD25- effectors. Previously activated T cells that had up-regulated surface TNFRII expression were used for in vitro regulatory assays as described in “Patients, materials, and methods.” Ninety-six-well microtiter plates were coated with anti-TNFRII mAb at 0.2 μg/well. CD4+CD25- T cells (5 × 10⁴/well), or CD4+CD25hi Tregs (5 × 10⁴/well) alone or mixed together at a ratio of 1:1 were stimulated with plate-bound anti-CD3 (1 μg/well), with or without anti-TNFRII. After 72 hours, 3H-thymidine incorporation was determined. (C) Culture supernatants were harvested and analyzed to determine the interferon γ content. Data are the mean ± SEM of 5 independent experiments. (D) Loss of suppressive function of CD4+CD25hi Tregs by TNFRII cross-linking. CD4+CD25- and CD4+CD25hi Tregs were sorted as described. For assessing the suppressor function in the presence of TNFRII, 5 × 10⁵ of CD4+CD25hi Tregs and 1 × 10⁶ CD4+CD25- T cells were labeled with CFSE and cultured (5 × 10⁴/well) with plate-bound anti-CD3 mAb (1 μg/well) with or without anti-TNFRII mAb (0.2 μg/well). For assessment of suppression, labeled CD4+CD25- T cells (5 × 10⁴) were cultured alone or at a 1:1 ratio with unlabeled CD4+CD25hi Tregs. After 3 days, cell proliferation was assessed by CFSE dilution. Data are representative of 3 independent experiments.
Figure 4.
Figure 4.
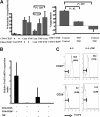
Preincubation with TNF suppresses the subsequent ability of CD4+CD25hi Tregs to inhibit the proliferation of CD4+CD25- T cells and decreases FOXP3 expression. (A) Freshly sorted CD4+CD25- T cells and CD4+CD25hi Tregs were incubated with TNF at 50 ng/mL in medium supplemented with IL-2 at 100 U/mL. After overnight incubation, cells were washed and examined for the capacity of CD4+CD25hi Tregs to suppress proliferation of CD4+CD25- T cells. Data are mean ± SEM from 6 different experiments. (B) FoxP3 expression is reduced by TNF incubation of CD4+CD25hi Tregs. CD4+CD25- and CD4+CD25hi T cells were sorted as described and cultured overnight with IL-2 and with or without TNF (50 ng/mL). Real-time PCR was carried out in triplicate for FoxP3 mRNA and relative fold changes were normalized to GAPDH. TNF caused significant suppression of FoxP3 in CD4+CD25hi Tregs after overnight incubation compared with that found in fresh cells (P < .01). (C) Intracellular FoxP3 staining was carried out with freshly isolated cells and the same cells after a 48-hour incubation with IL-2 alone or the combination of IL-2 and TNF (50 ng/mL). Similar results were noted after a 24-hour incubation. Data are representative of 3 different experiments. Numbers indicate the percentage of positive cells and those in parentheses, the mean fluorescence intensity of the stained cells.
Figure 5.
Figure 5.
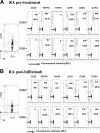
Phenotype of CD4+CD25hi Tregs from RA patients. (A) Purified CD4+ T cells were stained with anti-CD4 Cychrome and anti-CD25 PE and the population was sorted into CD4+CD25- and CD4+CD25hi subsets as indicated in “Patients, materials, and methods.” The resultant purity of CD4+CD25hi and CD4+CD25- T cells is shown. Purified populations were stained with anti-TNFRI-FITC-, anti-TNFRII-APC-, anti-GITR-FITC-, anti-CD69-FITC-, and anti-CCR4-APC-conjugated mAb as indicated. (B) Anti-TNF therapy down-regulates expression of TNFRII and GITR on CD4+CD25hi T cells. Freshly sorted CD4+CD25hi T-regulatory cells and CD4+CD25- effector cells were isolated from 15 RA patients treated with infliximab and their phenotype was characterized. Numbers in each box indicate the percentages of positive cells and those in parentheses, the mean fluorescence intensity of the stained cells. These changes in phenotype were compared with the phenotype of healthy donors, shown in Figure 1.
Figure 6.
Figure 6.
CD4+CD25hi T cells from active RA patients fail to suppress proliferation. CD4+CD25- responders (5 × 10⁴/well) and CD4+CD25hi Tregs (5 × 10⁴/well) were cultured with plate-bound anti-CD3 (1 μg/well) either alone or at a 1:1 ratio. After 72 hours, 3H-thymidine incorporation was determined. Results are the mean ± SEM of 15 separate experiments using patient samples compared with healthy donors. Also shown is the percent inhibition of proliferation of these 15 experiments.
Figure 7.
Figure 7.
CD4+CD25hi Tregs from active RA patients are defective suppressors. (A) CD4+CD25- responders (5 × 10⁴/well) and CD4+CD25hi Tregs (5 × 10⁴/well) were cultured with plate-bound anti-CD3 (1 μg/well) either alone or at a 1:1 ratio. After 72 hours, 3H-thymidine incorporation was determined. CD4+CD25- effectors from active RA patients were also cocultured with CD4+CD25hi Tregs from healthy individuals. Results are the mean ± SEM of 3 separate experiments. (B) Culture supernatants were diluted and analyzed to determine the amount of interferon γ. Data represent the mean ± SE of 5 different experiments.
Figure 8.
Figure 8.
CD4+CD25hi Tregs from RA patients recover their suppressive function after infliximab therapy. (A) FOXP3 mRNA expression is reduced in CD4+CD25hi Tregs of patients with active RA and recovers following treatment with infliximab. CD4+CD25- and CD4+CD25hi T cells were sorted as described from RA patients before (RA pre) and after (RA post) treatment with infliximab. Real-time PCR was carried out in triplicate for FOXP3 mRNA and relative fold changes were normalized to GAPDH. Data represent the mean ± SEM of 5 different experiments. The same RA patients were examined following 3 months of therapy with infliximab. Following infliximab therapy, FOXP3 mRNA levels in CD4+CD25hi Tregs of RA patients were significantly increased (P = .05) and not significantly different from that found in healthy controls. (B) FoxP3 protein expression in CD4+CD25hi Tregs recovers after anti-TNF treatment of RA patients. CD4+CD25- and CD4+CD25hi T cells were sorted as described. Intracellular FoxP3 staining was carried out in CD4+CD25- and CD4+CD25hi T cells sorted from an RA patient before and after infliximab therapy. (C) CD4+CD25- responders (5 × 10⁴/well) and CD4+CD25hi Tregs (5 × 10⁴/well) were isolated from active RA patients before infliximab therapy and after 3 months of infliximab treatment. Cells were cultured with plate-bound anti-CD3 (1 μg/well) either alone or at a 1:1 ratio. After 72 hours, 3H-thymidine incorporation was determined. Data represent the mean ± SE of 15 RA patients before and after infliximab treatment.

Similar articles

Cited by

References

    1. Kappler JW, Roehm N, Marrack P. T cell tolerance by clonal elimination in the thymus. Cell. 1987;49: 273-280. - PubMed
    1. Van Parijs L, Abbas AK. Homeostasis and selftolerance in the immune system: turning lymphocytes off. Science. 1998;280: 243-248. - PubMed
    1. Sakaguchi S. Regulatory T cells: key controllers of immunologic self-tolerance. Cell. 2000;101: 455-458. - PubMed
    1. Shevach EM. CD4+ CD25+ suppressor T cells: more questions than answers. Nat Rev Immunol. 2002;2: 389-400. - PubMed
    1. Sakaguchi S. Naturally arising CD4+ regulatory T cells for immunologic self-tolerance and negative control of immune responses. Annu Rev Immunol. 2004;22: 531-562. - PubMed

Publication types

MeSH terms