. 2006 Mar 14;34(5):1532-9.
doi: 10.1093/nar/gkl058. Print 2006.

A new method for gene discovery in large-scale microarray data

Affiliations

A new method for gene discovery in large-scale microarray data

Kentaro Yano et al. Nucleic Acids Res. .

Abstract

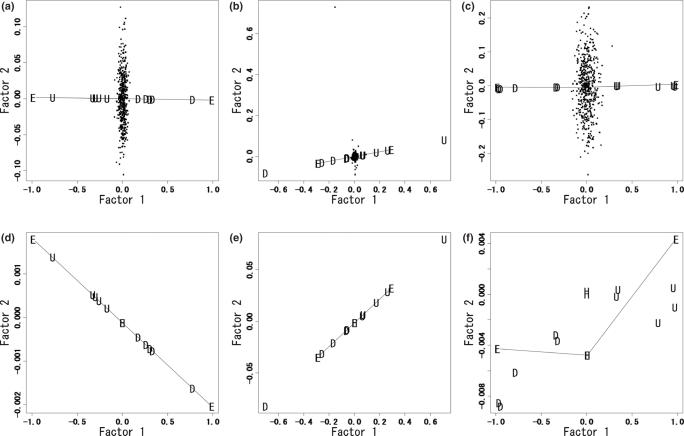
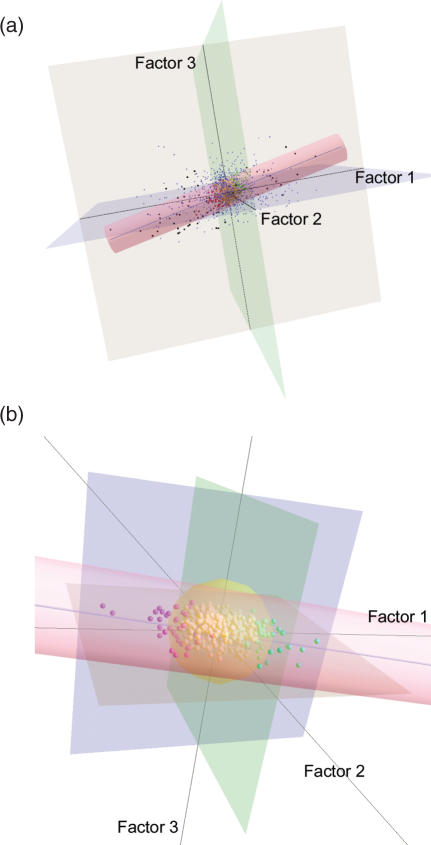
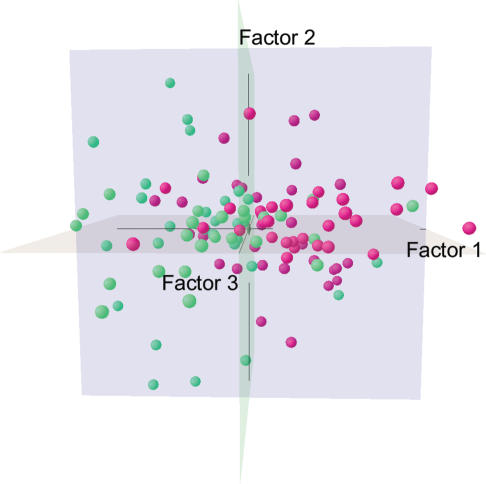
Microarrays are an effective tool for monitoring genome-wide gene expression levels. In current microarray analyses, the majority of genes on arrays are frequently eliminated for further analysis because the changes in their expression levels (ratios) are considered to be not significant. This strategy risks failure to discover whole sets of genes related to a quantitative trait of interest, which is generally controlled by several loci that make various contributions. Here, we describe a high-throughput gene discovery method based on correspondence analysis with a new index for expression ratios [arctan (1/ratio)] and three artificial marker genes. This method allows us to quickly analyze the whole microarray dataset and discover up-/down-regulated genes related to a trait of interest. We employed an example dataset to show the theoretical advantage of this method. We then used the method to identify 88 cancer-related genes from a published microarray data from patients with breast cancer. This method also allows us to predict the phenotype of a given sample from the gene expression profile. This method can be easily performed and the result is also visible in 3D viewing software that we have developed.


Figures

Figure 1
Figure 1
CA with three indices. Factor1 and Factor2, the first two axes obtained from CA, respectively; U, genes up-regulated (U1 to U5) in phenotype A samples; D, down-regulated genes (D1 to D5) in phenotype A samples; H, housekeeping genes (HK1 to HK3); E, ExtraGenes (ExtraGene1 to ExtraGene3); dots, unrelated genes (Unrelated1 to Unrelated500). (a) CA with the new index. (b) CA with an additively shifted logarithmic ratio. (c) CA with a rank index. (df) Plots of only U, D, H and E for (a–c), respectively.
Figure 2
Figure 2
CA plots for 24 024 genes in the first 3D subspace. Factor1, Factor2 and Factor3 show the first three axes obtained from CA, respectively. (a) CA plot for all of the analyzed 24 024 genes. The cylinder indicates the UDR. The blue line inside the UDR is the UDL. The 23 480 genes (small blue dots) unrelated to cancer are outside the UDR. The black dots out of the UDR correspond to 70 candidate genes identified by van't Veer et al. (21). (b) CA plot for the 544 genes inside the UDR. The 456 yellow spheres indicate significant housekeeping genes. Of the remaining 88 genes, the 43 red and 45 green spheres indicate statistically significant up- and down-regulated genes, respectively.
Figure 3
Figure 3
CA plot for the 115 samples. Factor1, Factor2 and Factor3 show the first three axes obtained from CA, respectively. Green and red spheres indicate samples from patients with poor and good prognoses, respectively.

References

    1. Tanaka T.S., Kunath T., Kimber W.L., Jaradat S.A., Stagg C.A., Usuda M., Yokota T., Niwa H., Rossant J., Ko M.S. Gene expression profiling of embryo-derived stem cells reveals candidate genes associated with pluripotency and lineage specificity. Genome Res. 2002;12:1921–1928. - PMC - PubMed
    1. Hughes T.R., Mao M., Jones A.R., Burchard J., Marton M.J., Shannon K.W., Lefkowitz S.M., Ziman M., Schelter J.M., Meyer M.R., et al. Expression profiling using microarrays fabricated by an ink-jet oligonucleotide synthesizer. Nat. Biotechnol. 2001;19:342–347. - PubMed
    1. Whitney A.R., Diehn M., Popper S.J., Alizadeh A.A., Boldrick J.C., Relman D.A., Brown P.O. Individuality and variation in gene expression patterns in human blood. Proc. Natl Acad. Sci. USA. 2003;100:1896–1901. - PMC - PubMed
    1. Mueller A., O'Rourke J., Grimm J., Guillemin K., Dixon M.F., Lee A., Falkow S. Distinct gene expression profiles characterize the histopathological stages of disease in Helicobacter-induced mucosa-associated lymphoid tissue lymphoma. Proc. Natl Acad. Sci. USA. 2003;100:1292–1297. - PMC - PubMed
    1. Sperger J.M., Chen X., Draper J.S., Antosiewicz J.E., Chon C.H., Jones S.B., Brooks J.D., Andrews P.W., Brown P.O., Thomson J.A. Gene expression patterns in human embryonic stem cells and human pluripotent germ cell tumors. Proc. Natl Acad. Sci. USA. 2003;100:13350–13355. - PMC - PubMed

Publication types

Substances