. 2006 Apr;26(7):2736-45.
doi: 10.1128/MCB.26.7.2736-2745.2006.

Identification and characterization of the CDK12/cyclin L1 complex involved in alternative splicing regulation

Affiliations

Identification and characterization of the CDK12/cyclin L1 complex involved in alternative splicing regulation

Hung-Hsi Chen et al. Mol Cell Biol. 2006 Apr.

Abstract

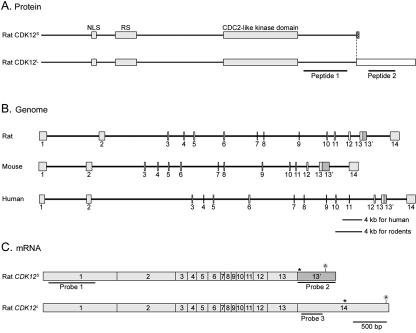
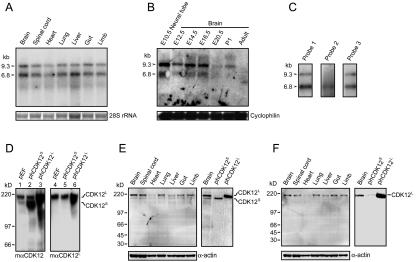
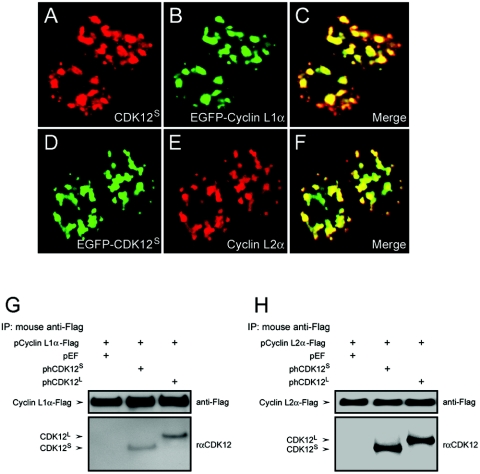
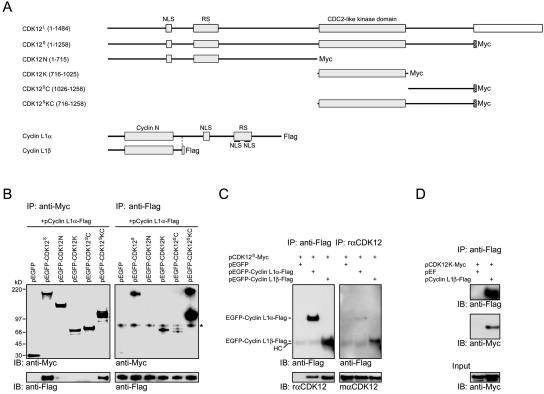
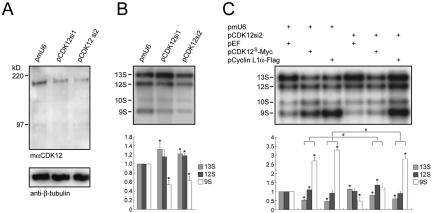
CrkRS is a Cdc2-related protein kinase that contains an arginine- and serine-rich (SR) domain, a characteristic of the SR protein family of splicing factors, and is proposed to be involved in RNA processing. However, whether it acts together with a cyclin and at which steps it may function to regulate RNA processing are not clear. Here, we report that CrkRS interacts with cyclin L1 and cyclin L2, and thus rename it as the long form of cyclin-dependent kinase 12 (CDK12(L)). A shorter isoform of CDK12, CDK12(S), that differs from CDK12(L) only at the carboxyl end, was also identified. Both isoforms associate with cyclin L1 through interactions mediated by the kinase domain and the cyclin domain, suggesting a bona fide CDK/cyclin partnership. Furthermore, CDK12 isoforms alter the splicing pattern of an E1a minigene, and the effect is potentiated by the cyclin domain of cyclin L1. When expression of CDK12 isoforms is perturbed by small interfering RNAs, a reversal of the splicing choices is observed. The activity of CDK12 on splicing is counteracted by SF2/ASF and SC35, but not by SRp40, SRp55, and SRp75. Together, our findings indicate that CDK12 and cyclin L1/L2 are cyclin-dependent kinase and cyclin partners and regulate alternative splicing.


Figures

FIG. 1.
FIG. 1.
Protein, mRNA, and genomic structures of CDK12S and CDK12L. (A) Protein domains of CDK12S and CDK12L. The amino acid sequences of rat CDK12S and CDK12L were analyzed by the MotifScan program. CDK12S and CDK12L share 1,249 amino acids of sequence. They contain a bipartite nuclear localization signal (NLS), an arginine- and serine-rich motif (RS), and a CDC2-like kinase domain (gray boxes). CDK12S and CDK12L display 9 (hatched box) and 235 (blank box) distinct amino acid residues, respectively, at their carboxyl termini. Peptides 1 and 2 were used to generate antisera. (B) Genomic organization of CDK12. The exons were identified by comparing the cDNA sequences with the genomic sequences. The genomic structure of CDK12 contains 14 exons and is conserved between human, mouse, and rat. (C) mRNAs of CDK12S and CDK12L. The CDK12S and CDK12L transcripts share exons 1 to 13, and the CDK12S transcript reads through exon 13′, while the CDK12L transcript splices exon 13 directly to exon 14. The probes used in Northern analysis are underlined. Stop codons are labeled with asterisks. The position of the polyadenylation signal is also indicated.
FIG. 2.
FIG. 2.
Expression of CDK12 in embryonic rat tissues. (A) We used 5 μg of total RNA from various E14.5 rat tissues analyzed by Northern blotting using probe 1 depicted in Fig. 1C. Two major transcripts, 6.8 kb and 9.3 kb (arrowheads), were detected. Ethidium bromide staining of 28S rRNA was used as the loading control. (B) We used 30 μg of total RNA derived from E10.5 neural tube and brain at various developmental stages analyzed by Northern blotting. The membrane was stripped and reprobed with cyclophilin for the loading control. (C) Polyadenylated mRNA from E14.5 rat brain analyzed by Northern blotting using probe 1, probe 2, or probe 3. Probe 1 and probe 3 detected two transcripts, while probe 2 detected only the 6.8-kb transcript. (D) We used 20 μg of cell extracts of HEK293T transfected with control vector (pEF), phCDK12S and phCDK12L to examine the specificity of the mαCDK12 and the mαCDK12L antisera. The mαCDK12 antiserum recognizes both CDK12S and CDK12L, and the mαCDK12L antiserum recognizes only CDK12L. (E) Western analysis of 15 μg of E14.5 rat tissue extracts performed using mαCDK12 (left panel). The sizes of CDK12S and CDK12L detected in the E14.5 brain by the mαCDK12 antiserum are the same as those detected in 4 μg of CDK12S- or CDK12L-overexpressed HEK293T cell lysates (right panel). (F) Western analysis of 15 μg of E14.5 rat tissue extracts performed using mαCDK12L (left panel). The size of CDK12L detected in the E14.5 brain by the mαCDK12L antiserum is the same as that detected in 4 μg of CDK12L-overexpressed HEK293T cell lysates (right panel). Membranes were reprobed with the anti-α-actin antibody as the loading control.
FIG. 3.
FIG. 3.
Interaction between CDK12 and cyclin L1 and cyclin L2. (A to C) HEK293T cells transfected with pCDK12S-Myc and pEGFP-cyclin L1α-Flag were stained with the rαCDK12 antiserum (A) and examined for EGFP fluorescence (B). The merged photograph shows that CDK12S colocalizes with cyclin L1α in nuclear speckles (C). (D to F) HEK293T cells transfected with pEGFP-CDK12S and pcyclin L2α-Flag were examined for EGFP fluorescence (D) and stained with anti-Flag antibody (E). The merged photograph shows that CDK12S colocalizes with cyclin L2α in nuclear speckles (F). (G and H) Lysates of HEK293T cells transfected with the vectors indicated above the panels were immunoprecipitated with the anti-Flag antibody. The immunoprecipitates were subjected to immunoblot analysis with the anti-Flag antibody or the rαCDK12 antiserum. The expected positions of cyclin L1α, cyclin L2α, CDK12L and CDK12S are shown by arrows.
FIG. 4.
FIG. 4.
Mapping of interaction domains between CDK12 and cyclin L1. (A) Schematic structures of CDK12L, Myc-tagged CDK12S, various Myc-tagged CDK12 truncated constructs, Flag-tagged cyclin L1α, and Flag-tagged cyclin L1β. (B) Lysates of HEK293T cells transfected with various CDK12 truncated constructs and pcyclin L1α-Flag were immunoprecipitated with the anti-Myc antibody. The immunoprecipitates were subjected to immunoblot analysis with the anti-Flag antibody or the rabbit anti-Myc antiserum (left panels). The same lysates were also immunoprecipitated with the anti-Flag antibody. The immunoprecipitates were subjected to immunoblot analysis with the anti-Flag antibody or the rabbit anti-Myc antiserum (right panels). A nonspecific band was recognized by the rabbit anti-Myc antiserum (asterisk). (C) Lysates of HEK293T cells transfected with the plasmids listed above the panel and immunoprecipitated with the anti-Flag antibody. The resulting proteins were then immunoblotted using the rabbit anti-Flag antiserum or the rαCDK12 antiserum (left panels). The same lysates were immunoprecipitated with the rαCDK12 antiserum. The resulting proteins were then immunoblotted using the mαCDK12 antiserum or the anti-Flag antibody (right panels). A faint band corresponding to the heavy chain (HC) of antibodies used in the immunoprecipitation was detected by the secondary antibodies. (D) Lysates of HEK293T cell transfected with pCDK12K-Myc and pEF or pcyclin L1β-Flag were immunoprecipitated with the anti-Flag antibody. The resulting proteins were then immunoblotted using the anti-Flag antibody or the rabbit anti-Myc antiserum.
FIG. 5.
FIG. 5.
Regulation of alternative splicing by CDK12 and cyclin L1. (A) A schematic diagram illustrating the splicing pattern of the E1a reporter gene. The alternative 5′ splice sites and splicing events that generate 13S, 12S, and 9S mRNAs are indicated above the diagram. The locations of the primers used for PCR analysis are marked by arrowheads. (B) HEK293T cells were transfected with 0.4 μg of pCEP4-E1a and 1.6 μg of phCDK12L or phCDK12S. The splicing assays were then performed as described under Materials and Methods. The upper panel shows a representative autoradiograph of the results. The positions of the 13S, 12S, 10S, and 9S transcripts are indicated on the left. The mean values and standard deviations from three independent experiments are shown in the lower panel. * indicates P < 0.05 in comparison to the control by paired t test. (C) HEK293T cells were transfected with 0.4 μg of pCEP4-E1a and the indicated amounts of pCDK12S-Myc. The upper panel shows a representative autoradiograph result. The mean values and standard deviations from three independent experiments are shown in the lower panel. * indicates P < 0.05 in comparison to the control by paired t test. (D) Splicing assays of HEK293T cells transfected with pCEP4-E1a (0.4 μg) and the indicated amounts of pcyclin L1α-Flag were performed. The upper panel shows a representative autoradiograph result. The mean values and standard deviations from three independent experiments are shown in the lower panel. * indicates P < 0.05 in comparison to the control by paired t test. (E) Splicing assays of HEK293T cells transfected with 0.4 μg of pCEP4-E1a and 2.8 μg of pCDK12S-Myc or pCDK12L-Myc and/or 0.8 μg of pcyclin L1β-Flag were performed. The upper panel shows a representative autoradiograph result. The mean values and standard deviations from four independent experiments are shown in the lower panel. * indicates P < 0.05 in comparison to the control and # indicates P < 0.05 between the pairs marked by connecting lines.
FIG. 6.
FIG. 6.
Changes in the alternative splicing pattern in cells with decreased expression of CDK12. (A and B) Proteins and RNAs of P19 cells transfected with 0.4 μg of pCEP4-E1a and 1.2 μg of pmU6, pCDK12si1, and pCDK12si2 were prepared. Proteins were subjected to Western analysis using the mαCDK12L antiserum (A). The membrane was reprobed with the anti-β-tubulin antibody. RNAs were subjected to splicing assays (B). The upper panel shows a representative autoradiograph result. Quantitative results derived from three independent experiments are shown in the lower panel. Standard deviations are indicated. * indicates P < 0.05 in comparison to the control by paired t test. (C) Splicing assays of P19 cells transfected with 0.4 μg of pCEP4-E1a and 0.6 μg of the plasmid indicated above each lane. The upper panel shows a representative autoradiograph result. The mean values and standard deviations from three independent experiments are shown in the lower panel. * indicates P < 0.05 in comparison to the control (lane 1) and # indicates P < 0.05 between the pairs marked by connecting lines.
FIG. 7.
FIG. 7.
Inhibition of CDK12 alternative splicing activity by SR proteins. (A and B) Splicing assays of HEK293T cells transfected with 0.4 μg of pCEP4-E1a and 1.8 μg of the plasmids listed above the panels were performed. The splicing assays were then performed as described under Materials and Methods. The upper panel shows a representative autoradiograph of the results. The positions of the 13S, 12S, 10S, and 9S transcripts are indicated on the right. The mean values and standard deviations from three independent experiments are shown in the lower panel. * indicates P < 0.05 in comparison to the control (lane 1) and # indicates P < 0.05 between the pairs marked by connecting lines by paired t test.

References

    1. Berke, J. D., V. Sgambato, P. P. Zhu, B. Lavoie, M. Vincent, M. Krause, and S. E. Hyman. 2001. Dopamine and glutamate induce distinct striatal splice forms of Ania-6, an RNA polymerase II-associated cyclin. Neuron 32:277-287. - PubMed
    1. Black, D. L. 2000. Protein diversity from alternative splicing: a challenge for bioinformatics and post-genome biology. Cell 103:367-370. - PubMed
    1. Brett, D., J. Hanke, G. Lehmann, S. Haase, S. Delbruck, S. Krueger, J. Reich, and P. Bork. 2000. EST comparison indicates 38% of human mRNAs contain possible alternative splice forms. FEBS Lett. 474:83-86. - PubMed
    1. Caceres, J. F., T. Misteli, G. R. Screaton, D. L. Spector, and A. R. Krainer. 1997. Role of the modular domains of SR proteins in subnuclear localization and alternative splicing specificity. J. Cell Biol. 138:225-238. - PMC - PubMed
    1. Chomczynski, P., and N. Sacchi. 1987. Single-step method of RNA isolation by acid guanidinium thiocyanate-phenol-chloroform extraction. Anal. Biochem. 162:156-159. - PubMed

Publication types

MeSH terms

Associated data