. 2006 Mar 15;26(11):2871-80.
doi: 10.1523/JNEUROSCI.5172-05.2006.

Differential projections of excitatory and inhibitory dorsal horn interneurons relaying information from group II muscle afferents in the cat spinal cord

Affiliations

Differential projections of excitatory and inhibitory dorsal horn interneurons relaying information from group II muscle afferents in the cat spinal cord

B Anne Bannatyne et al. J Neurosci. .

Abstract

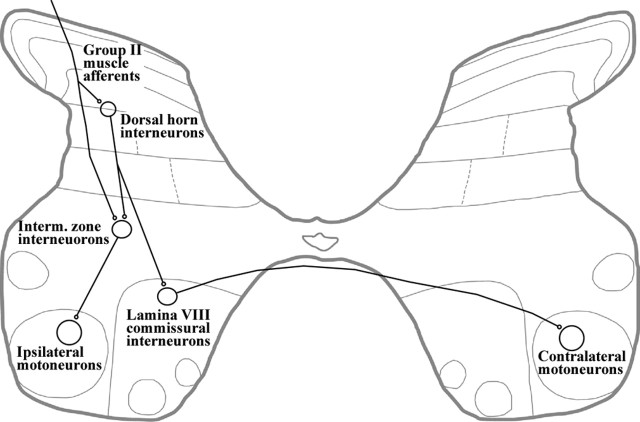
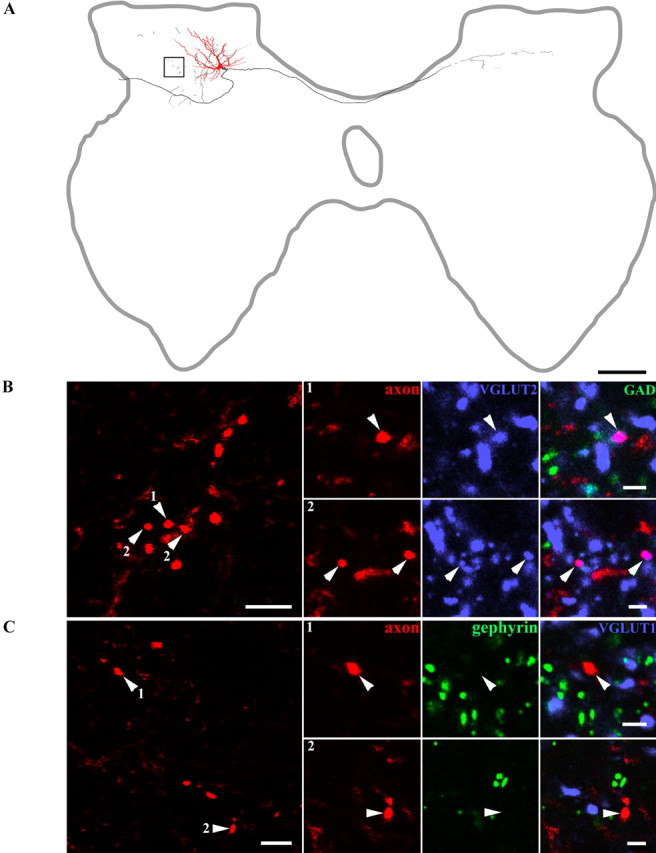
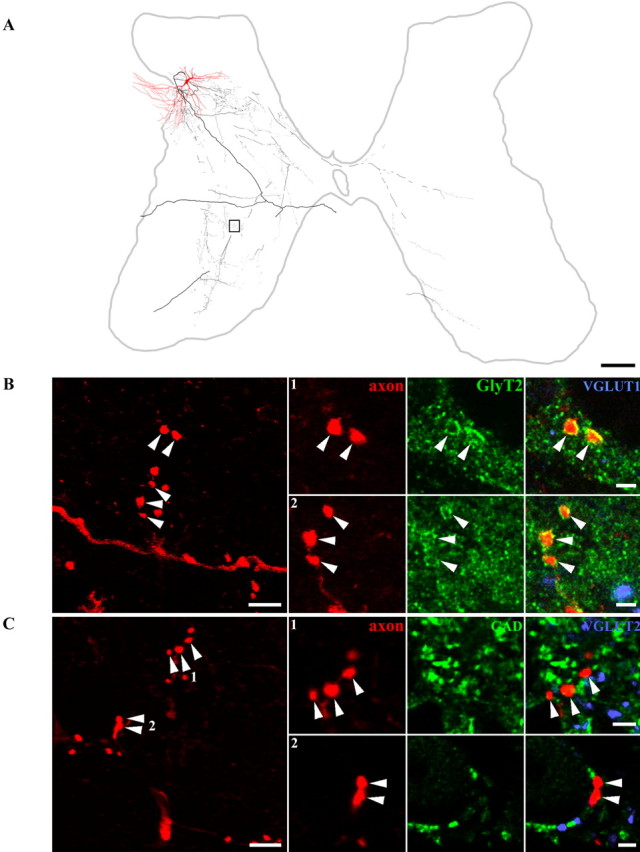
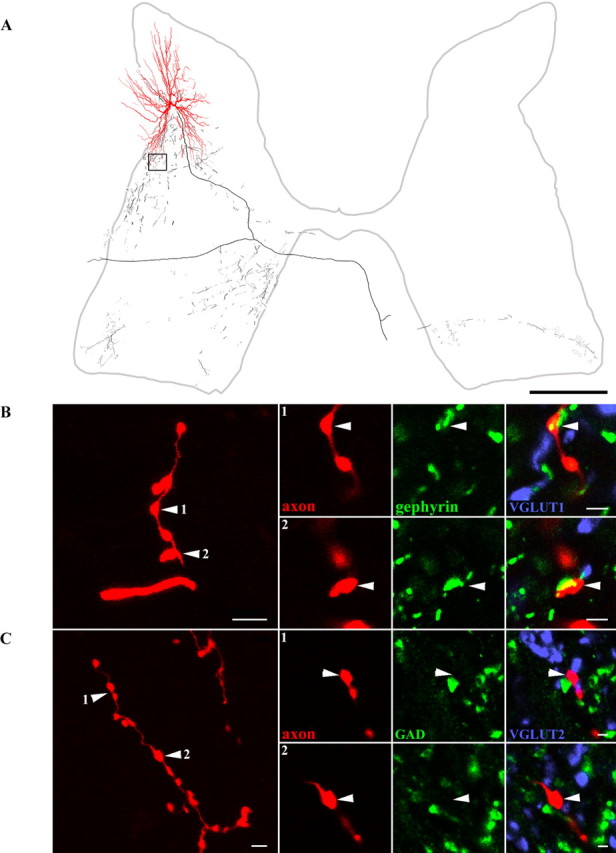
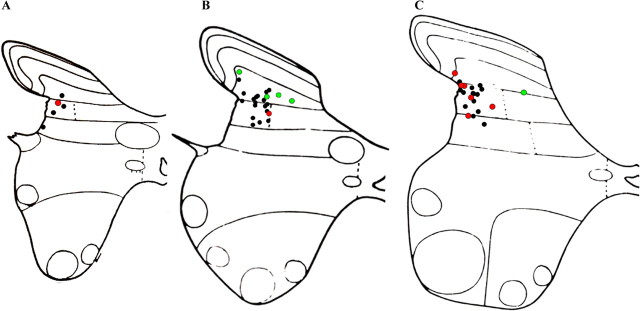
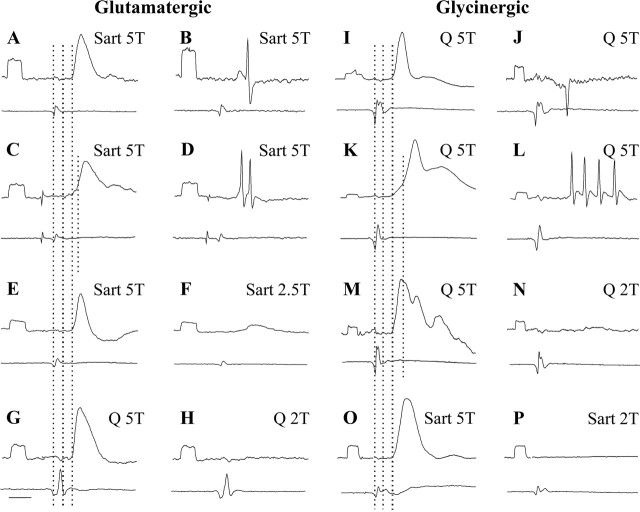
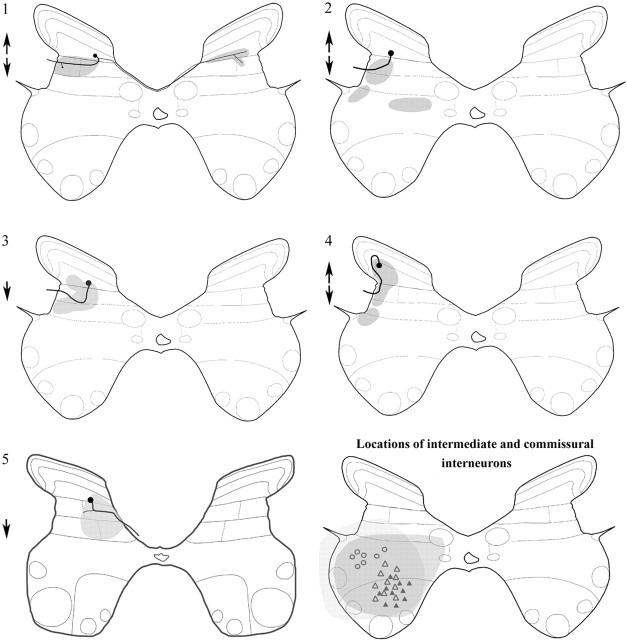
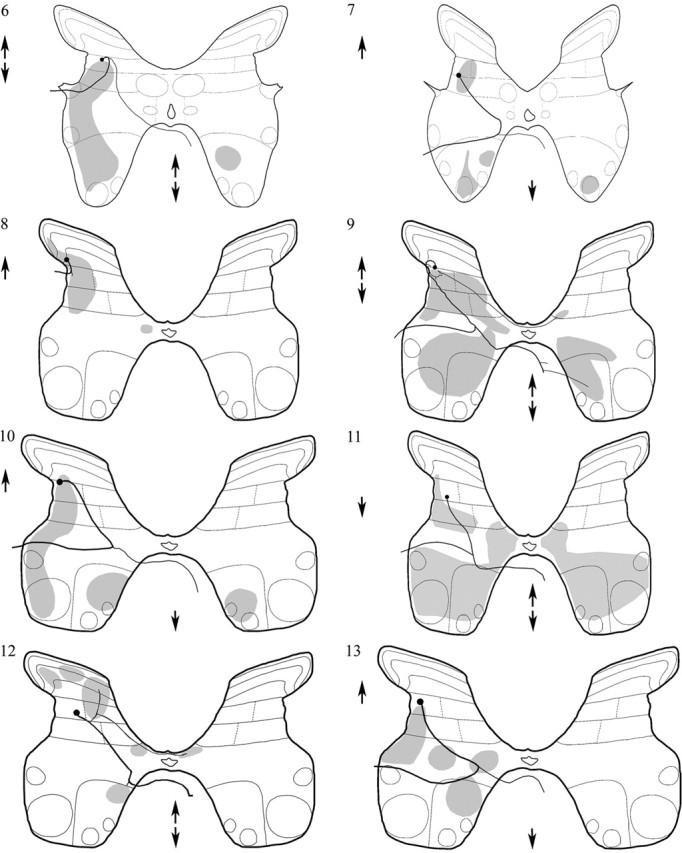
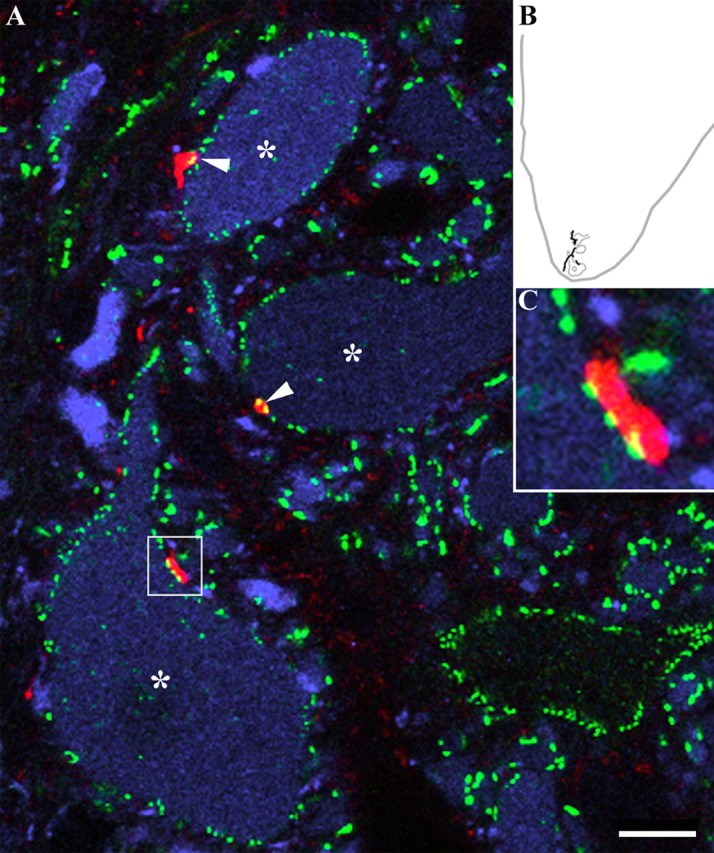
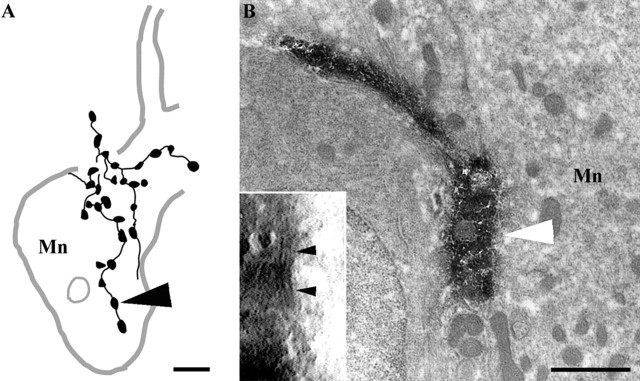
Dorsal horn interneurons with input from group II muscle spindle afferents are components of networks involved in motor control. Thirteen dorsal horn interneurons with monosynaptic group II input were characterized electrophysiologically and labeled intracellularly with Neurobiotin. Their axonal projections were traced, and neurotransmitter content was established by using immunocytochemistry. Two subpopulations were identified: five interneurons had axons that contained vesicular glutamate transporter 2 and hence were glutamatergic and excitatory. Terminals of the remaining eight interneurons were immunoreactive for the glycine transporter 2 or were apposed to gephyrin but did not contain the GABA-synthesizing enzyme glutamic acid decarboxylase and were therefore glycinergic and inhibitory. Excitatory cells were located mainly in the central region of lamina IV and had relatively small somata and restricted dendritic trees. In contrast, inhibitory interneurons were located more ventrally, in lamina V and had relatively larger somata and more extensive dendritic trees. Axonal projections of the two subpopulations differed considerably. Excitatory interneurons predominantly projected ipsilaterally, whereas most inhibitory interneurons projected both ipsilaterally and contralaterally. Three inhibitory axons formed contacts with large cholinergic cells in motor nuclei, thus revealing a novel direct coupling between inhibitory dorsal horn interneurons and motoneurons. The organization of the excitatory interneurons is consistent with current knowledge of reflex pathways to motoneurons, but the existence and connections of the inhibitory subpopulation could not be predicted from previous data. Our results indicate that these latter interneurons exercise widespread inhibitory control over a variety of cell types located on both sides of the spinal cord.


Figures

Figure 1.
Figure 1.
Hypothetical relationships between excitatory dorsal horn interneurons and premotor interneurons with group II input. Connections between dorsal horn interneurons and premotor interneurons in the intermediate zone and lamina VIII, which form synaptic contacts with ipsilateral and contralateral motoneurons, respectively (modified from Edgley et al., 2003, their Fig. 1; based on electrophysiological analysis of PSPs evoked from group II afferents in these interneurons and in motoneurons).
Figure 2.
Figure 2.
Morphology and immunocytochemical characteristics of a glutamatergic interneuron. A, Reconstruction of an interneuron (Table 2, cell 1), soma, and dendrites are shown in red, and the axonal arborization is shown in black. The box demarcates the area in which terminals shown below were located. B, A series of confocal microscope images illustrating the neurotransmitter content of boutons originating from this interneuron. The panel on the left shows a projected image made from several optical sections. Additional images of boutons (arrowheads) from single optical sections are shown in series of three to the right (1, 2). The axons are shown in red, immunoreactivity for VGLUT2 in blue, and immunoreactivity for GAD in green. The right panel of each series is a merged image confirming that the terminations are immunoreactive for VGLUT2. C, The panel on the left shows a projected image of a series of boutons. The two series of confocal images on the right illustrate single optical sections with the axon shown in red, immunoreactivity for VGLUT1 in blue, and gephyrin in green. There is no obvious relationship between immunolabeling for either antibodies and labeled interneuron terminals (1, 2). Scale bars: A, 400 μm; B, C (left panels), 5 μm; B, C (1, 2), 2 μm
Figure 3.
Figure 3.
Morphology and immunocytochemical characteristics of a glycinergic interneuron. A, Reconstruction of an interneuron (Table 2, cell 9), soma, and dendrites shown in red and axonal arborization in black. The axon terminals illustrated in B are taken from the area outlined by the box. B, A series of confocal microscope images illustrating neurotransmitter content of boutons originating from this interneuron: the left panel illustrates a projected image of a series of boutons. Additional images of boutons (arrowheads) from single optical sections are shown in panels 1 and 2 to the right. The axon is shown in red, immunoreactivity for GlyT2 in green, and VGLUT1 in blue. The right panel of each series is a merged image confirming that the ring-like immunoreactivity characteristic of GlyT2 staining is associated with labeled interneuronal terminals. C, Projected image of groups of terminals in the large panel on the left, with single optical sections through individual boutons in panels 1 and 2. Axon terminals are shown in red (arrowheads), immunoreactivity for GAD in green, and VGLUT2 in blue. There is no obvious relationship between interneuronal terminals and immunoreactivity for either of the other antibodies. Scale bars: A, 500 μm; B, C (left panels), 5 μm; B, C (1, 2), 2 μm
Figure 4.
Figure 4.
Morphology and immunocytochemical characteristics of a glycinergic interneuron. A, Reconstruction of an interneuron (Table 2, cell 10), soma, and dendrites shown in red and axonal arborization in black. The axon terminals illustrated in B are taken from the area outlined by the box. B, A series of images illustrating neurotransmitter content of boutons originating from this interneuron. The left panel illustrates a projected image of a series of boutons. Additional images of boutons (arrowheads) from single optical sections in panels 1 and 2 on the right show the axon in red, immunoreactivity for gephyrin in green, and VGLUT1 in blue. Merged images confirm the association between gephyrin and the interneuronal terminals. C, Projected images of groups of terminals in large panel to left, with single optical sections through individual boutons in panels 1 and 2. Axon terminals are shown in red (arrowheads), immunoreactivity for GAD in green, andVGLUT2 in blue. There is no obvious relationship between interneuronal terminals and immunoreactivity for these antibodies. Scale bars: A, 500 μm; B, C (left panels), 5 μm; B, C (1, 2), 4 μm.
Figure 5.
Figure 5.
Differential location of glutamatergic and glycinergic dorsal horn interneurons with monosynaptic input from group II muscle afferents. A–C, Diagrams showing locations of cell bodies of labeled interneurons in the L3–L5 segments of the lumbosacral enlargement, plotted on standard outlines of the spinal cord as described by Rexed (1954). VGLUT2-immunopositive cells are shown in green, and those immunopositive for GlyT2 or gephyrin are in red. The locations of interneurons that were labeled but not reconstructed are indicated in black.
Figure 6.
Figure 6.
Examples of PSPs evoked in glutamatergic and glycinergic interneurons. The top traces in each record were obtained from four glutamatergic interneurons (A and B, C and D, E and F, G and H; i.e., cells 3, 2, 1, and 4 in Table 2) and four glycinergic interneurons (I and J, K and L, M and N, O and P; i.e., cells 9, 11, 12, and 8 in Table 2), with negativity downward. B, D, J, and L are extracellular records; all other records are intracellular. The bottom traces in each record are from the cord dorsum, with the negativity upward. The stimuli were applied to the quadriceps (Q) and sartorius (Sart) nerves at intensities near maximal for group II afferents (5 times threshold) or maximal for group I afferents (2 or 2.5 times threshold). Dotted lines indicate the following: (1) afferent volleys from group I afferents, (2) estimated onset of group II volleys, (3) onset of monosynaptic EPSPs, and (4) onset of the most likely disynaptic EPSPs. Calibration pulses at the beginning of all microelectrode records are 0.5 mV time calibration 2 ms. For additional explanations, see Results.
Figure 7.
Figure 7.
Projections of glutamatergic interneurons. Cell bodies of interneurons are indicated by circles, stem axons are indicated as thick lines, and the areas in which terminals were visualized are shaded in gray. Numbers to the left indicate the number of the neuron in Table 2. Rostral and caudal projections are indicated by upward and downward arrows, respectively. Bottom right, Location of somata of intracellularly labeled intermediate zone interneurons (circles; modified from Bras et al., 1989) and commissural interneurons with monosynaptic input from group II afferents (open triangles; our unpublished data) or from reticulospinal tract neurons (filled triangles; our unpublished data) that are potential target cells of the dorsal horn interneurons. The light gray shading approximates the maximal dendritic spread of intermediate zone interneurons (modified from Bras et al., 1989), and the dark gray shading approximates that of lamina VIII commissural cells (modified from Bannatyne et al., 2003).
Figure 8.
Figure 8.
Projections of glycinergic interneurons. Cell bodies of the interneurons are indicated by circles, stem axons are indicated as thick lines, and the areas in which terminals were visualized are shaded in gray. Rostral and caudal projections are indicated by upward and downward arrows, respectively.
Figure 9.
Figure 9.
Evidence for contacts from a glycinergic interneuron onto motoneurons. A, An image composed of merged single optical sections illustrating appositions (arrowheads) formed by an interneuron axon (red) with three large cell bodies (*) in lamina IX (B) that were immunopositive for ChAT (blue). Immunoreactivity for gephyrin is shown in green. The terminal in the area enclosed by the box in A is shown at higher magnification in C. Gephyrin immunoreactivity was aligned at the junction between the axonal swelling and the motoneuron. Scale bar, 10 μm.
Figure 10.
Figure 10.
Electron microscopy of a glycinergic terminal. A, Drawing of part of an axon collateral (of cell 10 in Table 2) from ipsilateral lamina IX made from a light microscope section prepared for combined light and electron microscopy. Boutons were clustered around a large motoneuron (Mn) in the contralateral ventral horn. The bouton indicated by the arrowhead is shown in the electron micrograph in B. B, Electron microscopic examination confirmed that this bouton (arrow) made a synapse-like contact with the motoneuron (Mn). The inset shows the presence of symmetrical synaptic specializations (between arrows) that became apparent on following the bouton through serial sections. Scale bars: A, 10 μm; B, 1 μm.

References

    1. Aggelopoulos NC, Burton MJ, Clarke RW, Edgley SA (1996). Characterization of a descending system that enables crossed group II inhibitory reflex pathways in the cat spinal cord. J Neurosci 16:723–729. - PMC - PubMed
    1. Alvarez FJ, Dewey DE, Harrington DA, Fyffe RE (1997). Cell-type specific receptor organisation of glycine receptor clusters in the mammalian spinal cord. J Comp Neurol 397:150–170. - PubMed
    1. Arya T, Bajwa S, Edgley SA (1991). Crossed reflex actions from group II muscle afferents in the lumbar spinal cord of the anaesthetised cat. J Physiol (Lond) 444:117–131. - PMC - PubMed
    1. Bajwa S, Edgley SA, Harrison PJ (1992). Crossed actions on group II-activated interneurons in the midlumbar segments of the cat spinal cord. J Physiol (Lond) 455:205–217. - PMC - PubMed
    1. Bannatyne BA, Edgley SA, Hammar I, Jankowska E, Maxwell DJ (2003). Networks of inhibitory and excitatory commissural interneurons mediating crossed reticulospinal actions. Eur J Neurosci 18:2273–2284. - PMC - PubMed

Publication types

MeSH terms

LinkOut - more resources