Comparative Study
. 2006 May;12(5):851-61.
doi: 10.1261/rna.2309906. Epub 2006 Mar 15.

Control of mammalian translation by mRNA structure near caps

Affiliations
Comparative Study

Control of mammalian translation by mRNA structure near caps

Jeremy R Babendure et al. RNA. 2006 May.

Abstract

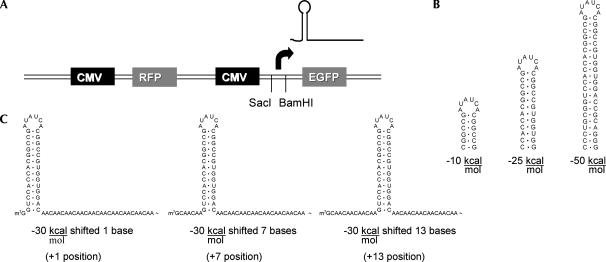
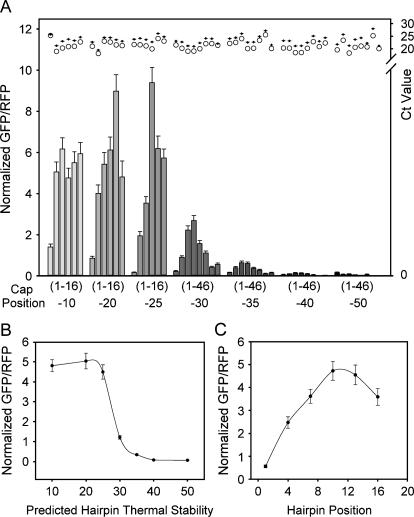
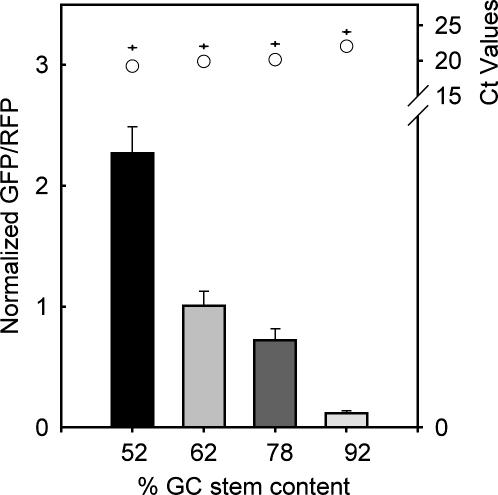
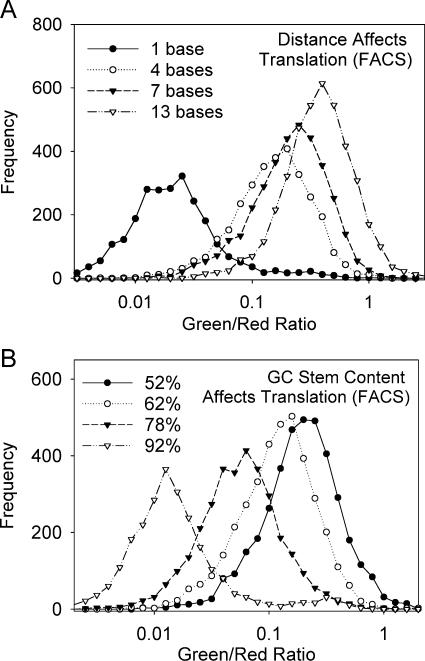
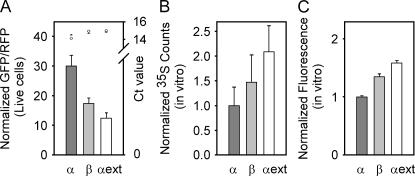
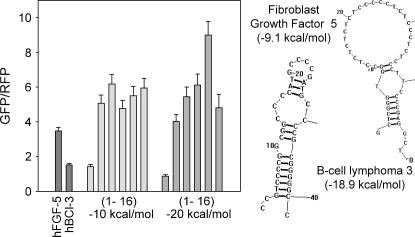
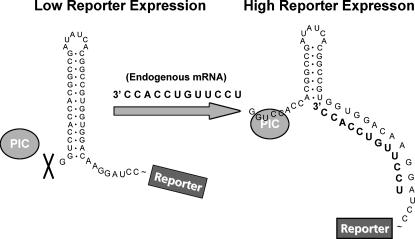
The scanning model of RNA translation proposes that highly stable secondary structures within mRNAs can inhibit translation, while structures of lower thermal stability also affect translation if close enough to the 5' methyl G cap. However, only fragmentary information is available about the dependence of translation efficiency in live mammalian cells on the thermodynamic stability, location, and GC content of RNA structures in the 5'-untranslated region. We devised a two-color fluorescence assay for translation efficiency in single live cells and compared a wide range of hairpins with predicted thermal stabilities ranging from -10 to -50 kcal/mol and 5' G cap-to-hairpin distances of 1-46 bases. Translation efficiency decreased abruptly as hairpin stabilities increased from deltaG = -25 to -35 kcal/mol. Shifting a hairpin as little as nine bases relative to the 5' cap could modulate translation more than 50-fold. Increasing GC content diminished translation efficiency when predicted thermal stability and cap-to-hairpin distances were held constant. We additionally found naturally occurring 5'-untranslated regions affected translation differently in live cells compared with translation in in vitro lysates. Our study will assist scientists in designing experiments that deliberately modulate mammalian translation with designed 5' UTRs.


Figures

FIGURE 1.
FIGURE 1.
Placement of hairpin inserts in two color fluorescence vector. (A) Map showing placement of RFP and EGFP with respective CMV promoters. SacI and BamHI restriction sites encompass transcriptional start site for EGFP. The arrow indicates the relative location of the transcription start site. (B) Sample folding of the −10, −25, and −50 kcal/mol hairpin structures. A total of seven hairpins were utilized including −10, −20, −25, −30, −35, −40, and −50. (C) Example of the −30 kcal/mol hairpin placed at positions +1, +7, and +13. An insert length of 70 nucleotides was maintained with CAA repeats. Different hairpins were placed at positions +1, +4, +7, +10, +13, +16, +31, and +46. A complete listing of hairpins inserted into vectors GR1 and GR2 is shown in Supplemental Figure S1. Thermal stability predictions and hairpin structures were drawn with RNAstructure 3.7 (Mathews et al. 1999).
FIGURE 2.
FIGURE 2.
Distance and thermal stability affect translation efficiency. (A) Each hairpin set is shown with increasing thermal stabilities (−10 to −50 kcal/mol) from left to right. Bars labeled (1–16) refer to hairpins placed at positions +1, +4, +7, +10, +13, and +16 from left to right for the −10, −20, and −25 kcal/mol hairpins. Bars labeled (1–46) refer to hairpins placed at positions +1, +4, +7, +10, +13, +16, +31, and +46 from left to right for the −30, −35, −40, and −50 kcal/mol hairpins. All values were normalized to their respective control CAA value. Error bars represent the standard error of the mean for 50 fields. Illustrated at top is quantitative RT–PCR data for each construct. Values represent the average of two Ct values for GFP (O) and RFP (+). (B) Average thermal stability effect on translation efficiency. Positions +1 to +16 for hairpins with predicted thermal stabilities between −10 and −25 kcal/mol and positions +1 to +46 for hairpins with predicted thermal stabilities between −30 and −50 kcal/mol were averaged. (C) Average distance effect on translation efficiency. Each position for hairpins with predicted thermal stabilities between −10 and −35 kcal/mol was averaged. Error bars are the standard error of the mean for B and C.
FIGURE 3.
FIGURE 3.
 GC stem content affects translation efficiency in Cos7 cells. The percent stem GC content increases from left to right. Error bars represent the standard error of the mean for 50 fields. All values were normalized to their respective control CAA value. Illustrated at top is quantitative PCR data for each construct. Values represent the average of two Ct values for GFP (O) and RFP (+).
FIGURE 4.
FIGURE 4.
FACS analysis compares translation efficiencies in a population. (A) Cap-to-hairpin distance affects translation efficiency in a population. Data curves for positions +10 and +16 were not included, however, show similar curves as +7 and +13, respectively. (B) Stem GC content affects translation efficiency in a population.
FIGURE 5.
FIGURE 5.
 Translation through natural 5′ UTRs differs in live cells vs. in vitro lysates. (A) Translation in live cells through α, β, or α ext globin 5′ UTRs was measured by fluorescence microscopy. Error bars represent the standard error of the mean for 40 fields. All values were normalized to their respective control CAA value. Illustrated at top is quantitative PCR data for each live cell construct. Values represent the average of two Ct values for GFP (O) and RFP (+). In vitro translation efficiency through α, β, or α ext globin was detected by either (B) radioactive 35S exposed to a PhosphorImaging screen, or (C) fluorescence intensity. Error bars represent the standard deviation of three independent experiments. Values were normalized to α globin.
FIGURE 6.
FIGURE 6.
 Translation efficiency with natural 5′ UTRs. Translation efficiencies of fibroblast growth factor 5 (FGF-5) and B cell lymphoma 3 (BCL-3) are compared with translation efficiencies from the −10 and −20 kcal/mol hairpin sets (Fig. 2). Bars labeled (1–16) refer to hairpins placed at positions +1, +4, +7, +10, +13, and +16 from left to right for the −10 and −20 kcal/mol hairpins. Error bars represent the standard error of the mean for 20 fields. Shown to the right are predicted structures drawn with RNAstructure 3.7 (Mathews et al. 1999) for FGF-5 and BCL-3.
FIGURE 7.
FIGURE 7.
General strategy for mRNA modulation. In the low reporter expression state, an RNA structural blockade inhibits the ribosomal pre-initiation complex (PIC) from binding. As a result, the ribosome never reaches the translation start site for the reporter protein. Upon binding RNA (presumably endogenous mRNA), the structural blockade is altered, potentially by shifting hybridized RNA structures downframe. This shift leads to PIC binding, allowing the ribosome to reach the translation start-site translating reporter protein.

References

    1. Bayer T.S., Smolke C.D. Programmable ligand-controlled riboregulators of eukaryotic gene expression. Nat. Biotechnol. 2005;23:337–343. - PubMed
    1. Brantl S. Antisense-RNA regulation and RNA interference. Biochim. Biophys. Acta. 2002;1575:15–25. - PubMed
    1. Campbell R.E., Tour O., Palmer A.E., Steinbach P.A., Baird G.S., Zacharias D.A., Tsien R.Y. A monomeric red fluorescent protein. Proc. Natl. Acad. Sci. 2002;99:7877–7882. - PMC - PubMed
    1. Davidson E.A., Ellington A.D. Engineering regulatory RNAs. Trends Biotechnol. 2005;23:109–112. - PubMed
    1. de Benedetti A., Harris A.L. eIF4E expression in tumors: Its possible role in progression of malignancies. Int. J. Biochem. Cell Biol. 1999;31:59–72. - PubMed

Publication types

MeSH terms

LinkOut - more resources