. 2006 Apr 5;25(7):1456-68.
doi: 10.1038/sj.emboj.7601039. Epub 2006 Mar 16.

RNA-binding IMPs promote cell adhesion and invadopodia formation

Affiliations

RNA-binding IMPs promote cell adhesion and invadopodia formation

Jonas Vikesaa et al. EMBO J. .

Abstract

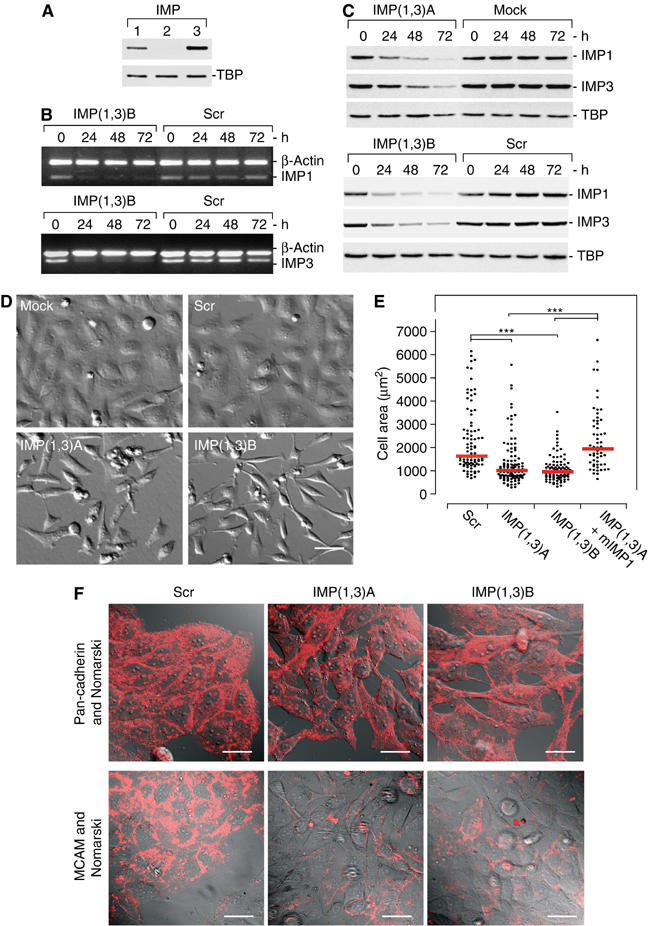
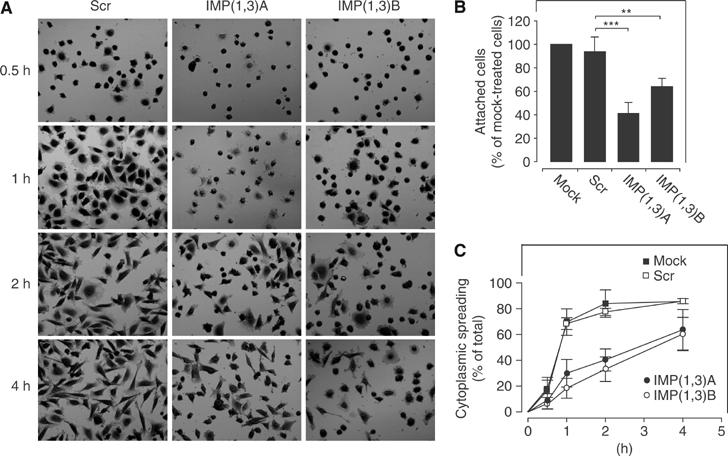
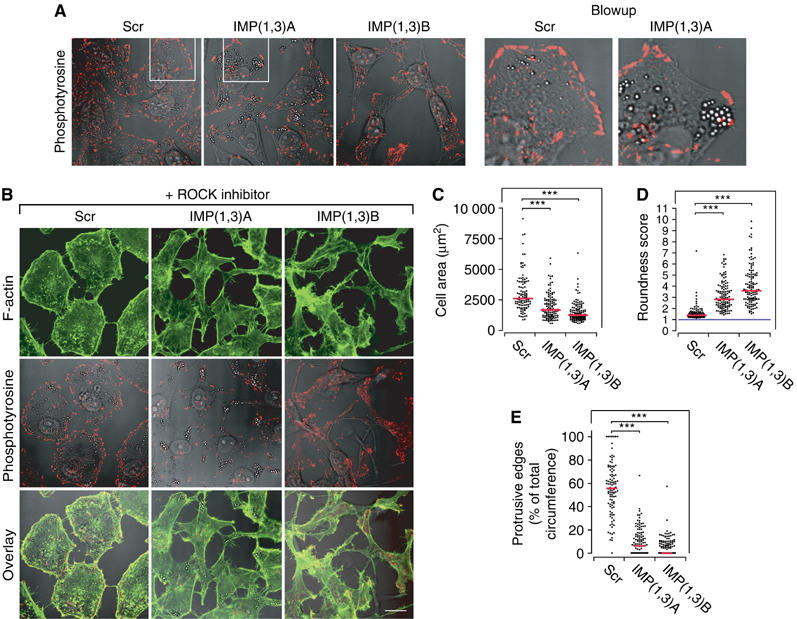
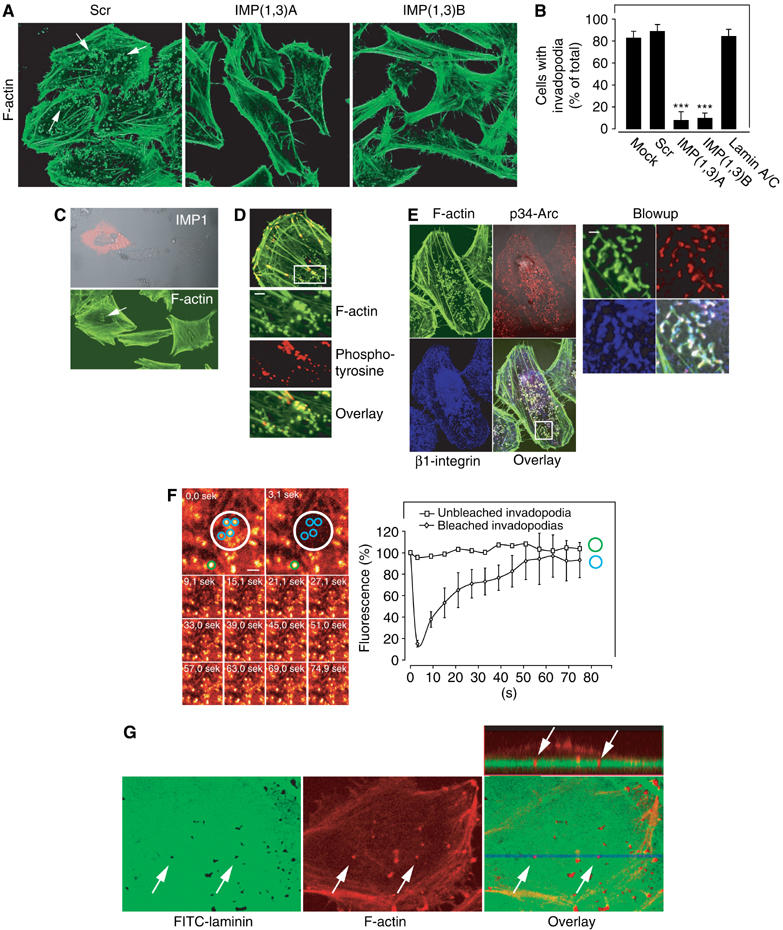
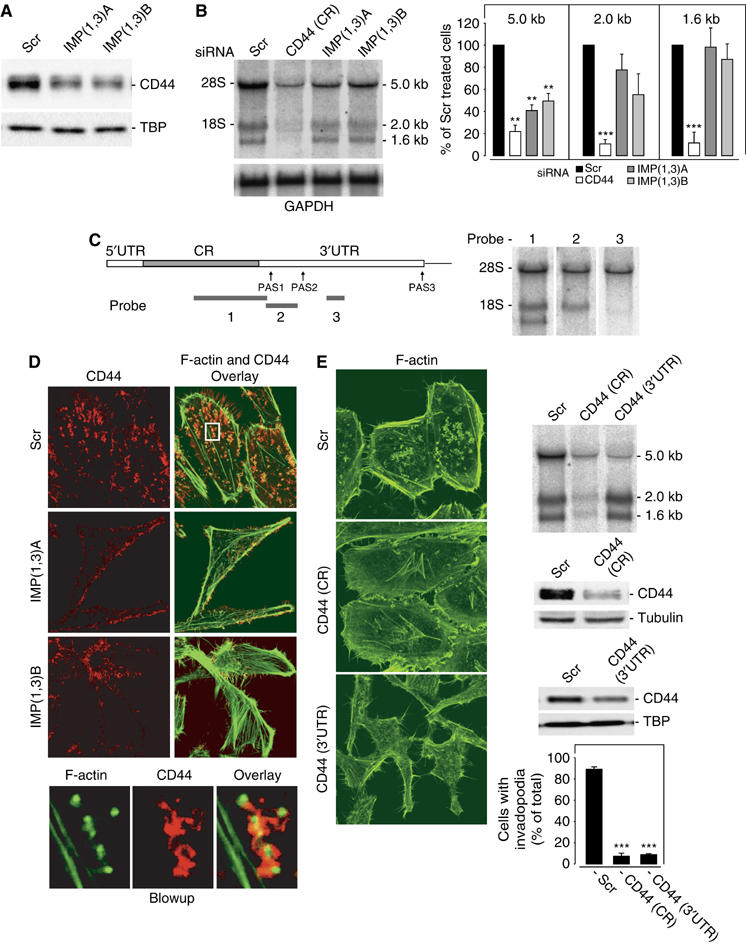
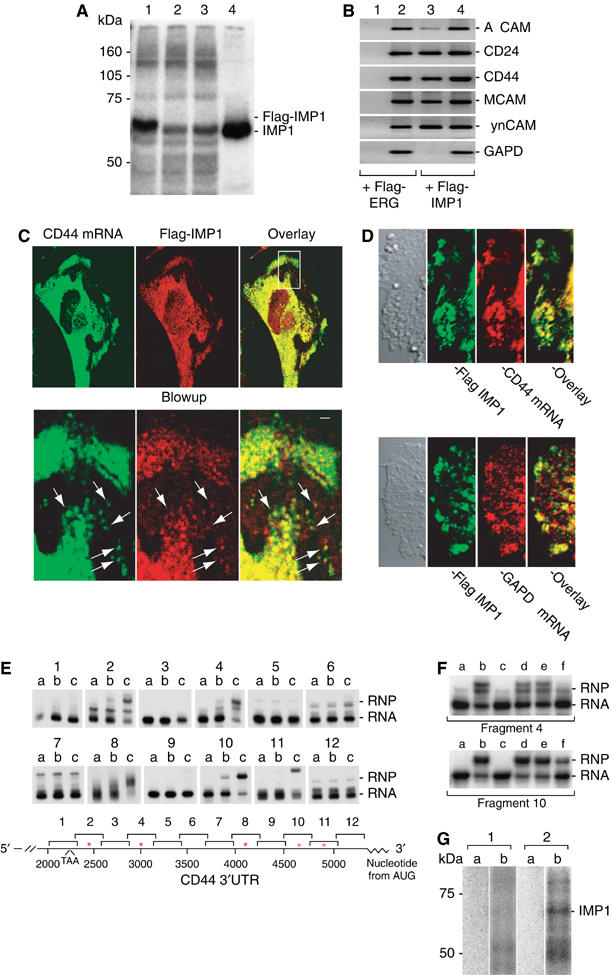
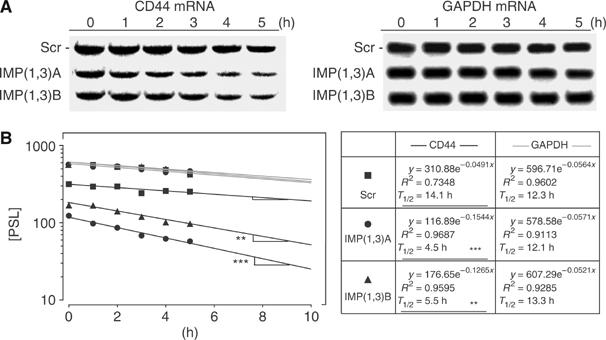
Oncofetal RNA-binding IMPs have been implicated in mRNA localization, nuclear export, turnover and translational control. To depict the cellular actions of IMPs, we performed a loss-of-function analysis, which showed that IMPs are necessary for proper cell adhesion, cytoplasmic spreading and invadopodia formation. Loss of IMPs was associated with a coordinate downregulation of mRNAs encoding extracellular matrix and adhesion proteins. The transcripts were present in IMP RNP granules, implying that IMPs were directly involved in the post-transcriptional control of the transcripts. In particular, we show that a 5.0 kb CD44 mRNA contained multiple IMP-binding sites in its 3'UTR, and following IMP depletion this species became unstable. Direct knockdown of the CD44 transcript mimicked the effect of IMPs on invadopodia, and we infer that CD44 mRNA stabilization may be involved in IMP-mediated invadopodia formation. Taken together, our results indicate that RNA-binding proteins exert profound effects on cellular adhesion and invasion during development and cancer formation.


Figures

Figure 1
Figure 1
RNAi-mediated knockdown of IMP proteins. (A) IMP expression in HeLa cells was determined by Western blot analysis using rabbit polyclonal anti-IMP1 (lane 1), anti-IMP2 (lane 2) or anti-IMP3 (lane 3) antibodies. TATA-box binding protein (TBP) was used as loading control. (B) siRNA-mediated downregulation of IMP1 and IMP3 mRNA in IMP(1,3)B- or Scr siRNA-treated cells was examined by multiplex RT–PCR. RT–PCR was performed at the indicated times using IMP1 and β-actin-specific primers (upper panel) or IMP3 and β-actin-specific primers (lower panel), respectively. The PCR fragments were resolved on a 1% agarose gel and visualized by ethidium bromide staining. (C) siRNA-mediated downregulation of IMP1 and IMP3 proteins in IMP(1,3)A-, IMP(1,3)B- or Scr siRNA-treated cells was examined by Western blot analysis. The cells were harvested 24, 48 or 72 h after transfection and proteins were detected with anti-IMP1, anti-IMP3 or anti-TBP antibodies. Blots were quantified using a LAS-1000 luminescent imager analyser (Fuji). (D) Morphology of IMP-depleted cells. HeLa cells were mock treated or transfected with Scr, IMP(1,3)A or IMP(1,3)B siRNAs. At 72 h after transfection, the living cells were photographed (× 400, scale bar, 50 μm). (E) Scatter plot of the 2D area (μm2) of fixed siRNA-treated cells. To verify that the morphological changes were caused by downregulation of IMP, IMP(1,3)A-treated cells were transfected with a plasmid encoding mIMP1. mIMP1-transfected cells were identified by IMP1 immunostaining. Each point represents a cell and the medians are indicated (red line). Asterisks depict statistically significant differences between the indicated groups, by a Mann–Whitney test (***P<0.001). The number of cells measured in the groups were—Scr: n=91, IMP(1,3)A: n=109, IMP(1,3)B: n=88 and IMP(1,3)A+mIMP1: n=57. (F) Expression of the cell–cell adhesion molecule MCAM and pan-cadherin in IMP-depleted cells. Semiconfluent cultures treated with Scr siRNA, IMP(1,3)A or IMP(1,3)B siRNAs were stained with mouse anti-MCAM and anti-pan-cadherin antibody and Texas-Red conjugated anti-mouse IgG. Scale bar, 50 μm.
Figure 2
Figure 2
Adhesion and cytoplasmic spreading after IMP depletion. (A) HeLa cells were transfected with Scr, IMP(1,3)A or IMP(1,3)B siRNAs, respectively, before they were trypsinized and allowed to re-seed on a laminin-1-coated surface. The cells were fixed at the indicated times and stained with crystal violet. (B) The number of adhered cells was counted 1 h after seeding. The data are stated as percentage of mock-treated cells (100%) and represent the mean value±s.d. Asterisks depict statistically significant differences between the indicated groups, by an unpaired, unequal t-test (**P<0.01, ***P<0.001) of five independent experiments, where at least 1500 cells were scored in each group, in each experiment. (C) The number of mock-treated (▪), Scr siRNA-treated (□), IMP(1,3)A siRNA-treated (•) and IMP(1,3)B siRNA-treated (○) cells with cytoplasmic spreading were quantitated at the indicated times following seeding. Data are presented as the mean value±s.d. of at least three independent experiments.
Figure 3
Figure 3
Formation of FX-supported protrusive edges in IMP-depleted cells. (A) HeLa cells were transfected with Scr, IMP(1,3)A or IMP(1,3)B siRNAs, respectively, and stained with anti-phosphotyrosine antibody to reveal FXs and FA (left panel). Blowups (right panel) illustrate the characteristic convex FX-supported edge in an Scr-treated cell and a typical concave FX-depleted edge in an IMP siRNA-treated cell. (B) HeLa cells were transfected with Scr, IMP(1,3)A or IMP(1,3)B siRNAs, respectively, and incubated with 10 μM ROCK inhibitor (Y-27632) for 20 h and stained for F-actin (top row) or for phosphotyrosine (middle row). An overlay of these is shown in the bottom row. Scale bar, 50 μm. (C) Scatter plot of the 2D area of ROCK inhibitor-treated cells following IMP depletion. (D) Scatter plot of the roundness score from ROCK inhibitor-treated cells following IMP depletion. Cells were scored according to the formula (length of circumference)2/(4π*cell area), which is 1 for a circle (blue line). The more a cell differs from a circular shape, the higher the score. (E) Scatter plot showing the percentage of protrusive edge in IMP-depleted cells compared to Scr siRNA-treated cells. Each point in panels (C)–(E) represents a cell and the medians are indicated (red line). Asterisks depict statistically significant differences between the indicated groups, by a Mann–Whitney test (***P<0.001). The number of cells measured or scored in the groups were—Scr: n=107, IMP(1,3)A: n=122 and IMP(1,3)B: n=125.
Figure 4
Figure 4
Invadopodia in IMP-depleted cells. (A) Loss of actin-rich structures located at the cell–substratum interface. HeLa cells were transfected with Scr, IMP(1,3)A or IMP(1,3)B siRNAs, respectively, and stained with phalloidin to reveal F-actin-rich dot-like structures (arrows) resembling podosomes or invadopodia. (B) The percentile of cells containing podosomes or invadopodia after transfection with Scr, IMP(1,3)A, IMP(1,3)B or lamin A/C siRNAs was determined. Data are presented as the mean value±s.d. of three independent experiments. Asterisks depict statistically significant differences between the Scr siRNA-treated cells and the IMP(1,3)A and IMP(1,3)B siRNA-treated cells, respectively, by an unpaired, unequal t-test (***P<0.001). (C) HeLa cells were depleted for IMP and transfected with a mIMP1 expression plasmid—revealed by staining with anti-IMP1 (red)—which rescued podosome/invadopodia-like structures revealed by phalloidin staining (green). (D) Immunocytochemical analysis of tyrosine-phosphorylated proteins in the podosomes/invadopodia-like structures. HeLa cells were stained with Alexa Flour 488 conjugated phalloidin (green) and mouse anti-phosphotyrosine stained with Texas-Red conjugated anti-mouse antibody (red). The white box depicts the position of the blowups. Scale bar, 2 μm. (E) Immunocytochemical analysis of Arp2/3 complex protein p34-Arc and β1 integrin in the podosomes/invadopodia-like structures. HeLa cells were stained with phalloidin as above (green), in combination with rabbit anti-p34-Arc (red) and mouse anti-β1 integrin (blue) visualized with Texas-Red conjugated anti-rabbit antibody and Alexa Fluor 660 conjugated anti-mouse antibody, respectively (left panel). The white box depicts the position of the blowups (right panel). Scale bar, 2 μm. (F) Dynamics of podosome/invadopodia-like structures. HeLa cells were transfected with pEYFP-actin-expressing plasmid and actin turnover was examined by a FRAP analysis. The two upper pictures in the left panel show the area that was bleached before and after activation of the laser (white circle). The lower pictures show the recovery of EYFP-actin in the bleached area. The right panel shows the quantification of the recovery of EYFP-actin in the bleached area. The light intensity was measured in circular areas surrounding each of the four actin-rich structures present in the bleached area (blue circles). The green circle indicates the spot outside the bleached area that was used as reference. The results are stated as mean value±s.d. of the four blue circles in percentage of light emitted before bleaching. (G) ECM degradation assay. HeLa were seeded on an FITC-laminin-1-containing matrix, the cells were fixed and stained with Alexa Flour 660 conjugated phalloidin to depict the position of podosome/invadopodia-like structures. The dish was examined by confocal z-stacking, and the three lower pictures depict one of these slices, which show the colocalization between the matrix degradation spots and invadopodia structures. The upper right panel shows a vertical cross-section (lower right panel, blue line) of the cell and the underlying matrix with the projected invadopodia (arrows).
Figure 5
Figure 5
CD44 in invadopodia formation. CD44 protein and mRNA levels in IMP-depleted cells. (A) Western blot analysis of CD44 in HeLa cells transfected with Scr, IMP(1,3)A or IMP(1,3)B siRNAs, respectively. TBP was used as loading control (B) Northern blot analysis of CD44 mRNA under the same conditions (left panel). The right panel shows the quantification of the 5.0, 2.0 and 1.6 kb CD44 transcripts during knockdown. GAPDH was used as loading control. (C) Schematic representation of the full-length CD44 transcript outlining the position of the different polyadenylation signals (PAS) and probes designated 1, 2 and 3, that were used in the Northern blot analysis shown to the right. 5′UTR—5′untranslated region; CR—coding region; 3′UTR—3′untranslated region. (D) CD44 is associated with invadopodia formation. HeLa cells were stained with mouse anti-CD44 antibody and phalloidin to depict F-actin. The blowup below shows that the CD44 protein is located in close proximity to invadopodia. (E) Loss of invadopodia in CD44-depleted cells. HeLa cells were treated with Scr siRNA or siRNA targeting the CD44 mRNA coding region (CR) or the 3′UTR (left panel). The upper right panel shows a Northern blot analysis of the siRNA-treated cells. At 72 h after transfection, the cells were harvested and the level of CD44 protein was determined by Western blot analysis (middle right panel). β-Tubulin or TBP was included as loading control. Finally, the cells were stained for F-actin and the number of invadopodia were counted (lower right panel). Data are presented as the mean value±s.d. of three independent experiments (lower right panel). Asterisks depict statistically significant differences between the Scr and CD44 siRNA-treated cells, by an unpaired, unequal t-test (***P<0.001).
Figure 6
Figure 6
IMP binding to and colocalization with CD44 mRNA. (A) Binding of Flag-tagged IMP1 to H19 RNA target. UV crosslinking of [α-32P]UTP-labelled H19 RNA was performed with extracts from HeLa cells expressing Flag-IMP1 (lane 1), Flag-ERG (lane 2), nontransfected HeLa cells (lane 3) or with 5 nM recombinant IMP1 (lane 4). The position of IMP1 and Flag-IMP1 RNP complexes is indicated to the right. (B) Isolation of IMP1 RNP particles. Flag-tagged-ERG or Flag-tagged IMP1 proteins, respectively, were transiently expressed in HeLa cells. After lysis, the tagged proteins were pelleted by incubation with anti-Flag-coated beads. ALCAM, CD24, CD44(5.0 kb), MCAM, SynCAM and GAPDH transcripts were detected by RT–PCR in the pelleted beads (lanes 1 and 3) or in the lysates (lanes 2 and 4). (C) Colocalization of CD44 mRNA and Flag-IMP1 in lamellipodia and cellular protrusions and perinuclear regions. Flag-IMP1 was stained with Texas-Red conjugated anti-mouse IgG (red) and CD44 mRNA was detected with a digoxigenin-labelled probe followed by staining with HRP-conjugated sheep anti-digoxigenin antibody and Alexa Fluor 488 tyramide (green). The white box depicts the position of the blowups (lower panel) and the arrows indicate Flag-IMP1 and CD44 mRNA colocalized in RNP granules. Scale bar, 1500 nm. (D) Colocalization of CD44 mRNA and Flag-IMP1. HeLa cells were transfected with Flag-IMP1 expression vector and stained with mouse anti-Flag and visualized with FITC-conjugated anti-mouse IgG antibody (green). The localization of CD44 mRNA (red) was subsequently determined by in situ hybridization with a digoxigenin-labelled CD44 antisense probe detected with rhodamine-conjugated sheep anti-digoxigenin (upper panel). Control cells were incubated with a digoxigenin-labelled GAPDH probe (lower panel). (E) Binding of recombinant IMP1 to the 3′UTR of CD44 mRNA. An electrophoretic mobility shift analysis was performed (upper panel) with RNA fragments covering the entire CD44 3′UTR in the presence of buffer (lane a) or 1.5 (lane b) or 4.5 nM (lane c) recombinant IMP1, respectively. The migration of the RNP (RNP) complexes and the labelled RNA (RNA) is indicated to the right. The lower panel shows the positions of the individual RNA fragments (1–12), which are numbered according to their distances from the A in the translation start codon of CD44 mRNA (NM_000610). The positions of IMP1-binding sites are indicated by asterisks. (F) Competitive inhibition of IMP1 binding. An electrophoretic mobility shift assay was performed with CD44 3′UTR fragment 4 (upper panel) and CD44 3′UTR fragment 10 (lower panel) in the presence of buffer (lane a), 4.5 nM recombinant IMP1 (lane b), 4.5 nM IMP1 and 10 nM A11 SELEX RNA target (lane c), 4.5 nM IMP1 and 10 ng poly(A) (lane d), 4.5 nM IMP1 and 10 nM CD44 3′UTR fragment 7 (lane e), and 4.5 nM IMP1 and 10 ng total RNA from RD cells (lane f). The positions of the RNP complexes (RNP) and the labelled RNA (RNA) are indicated. (G) [α-32P]UTP-labelled CD44 RNA fragment 3133–3952 (1) and CD44 RNA fragment 3928–5040 (2) were subjected to UV light in the absence (a) or presence (b) of a cytoplasmic extract from Hela cells, followed by RNase A digestion and SDS polyacrylamide gel electrophoresis to resolve labelled proteins. The numbering of the fragments corresponds to the position numbering from the AUG codon of the CD44 transcript variant 1 (NM_000610). The position of the IMP1 RNP complex is indicated to the right.
Figure 7
Figure 7
CD44 mRNA half-life in IMP-depleted cells. (A) HeLa cells were transfected with Scr, IMP(1,3)A or IMP(1,3)B siRNAs as indicated. After 72 h, they were incubated with 5 μM actinomycin D for the indicated times before the levels of CD44 and GAPDH mRNA were determined by Northern blot analysis. (B) The transcript levels were determined by phosphoimager counting and the left panel shows the mRNA decay plotted in a logarithmic scale. The lines represent the linear regression of the data. The right box shows the equation of the linear regression and the calculated half-life of the mRNAs. Asterisks depict statistically significant differences between the slope of the CD44 mRNA decline from Scr siRNA-treated cells and the slope of the CD44 mRNA decline from IMP(1,3)A or IMP(1,3)B siRNA-treated cells, respectively, calculated by the GraphPad Prism 4 software (**P<0.01, ***P<0.001).

References

    1. Atlas R, Behar L, Elliott E, Ginzburg I (2004) The insulin-like growth factor mRNA binding-protein IMP-1 and the Ras-regulatory protein G3BP associate with tau mRNA and HuD protein in differentiated P19 neuronal cells. J Neurochem 89: 613–626 - PubMed
    1. Bourguignon LY, Gunja-Smith Z, Iida N, Zhu HB, Young LJ, Muller WJ, Cardiff RD (1998) CD44v(3,8–10) is involved in cytoskeleton-mediated tumor cell migration and matrix metalloproteinase (MMP-9) association in metastatic breast cancer cells. J Cell Physiol 176: 206–215 - PubMed
    1. Buccione R, Orth JD, McNiven MA (2004) Foot and mouth: podosomes, invadopodia and circular dorsal ruffles. Nat Rev Mol Cell Biol 5: 647–657 - PubMed
    1. Chuang YY, Tran NL, Rusk N, Nakada M, Berens ME, Symons M (2004) Role of synaptojanin 2 in glioma cell migration and invasion. Cancer Res 64: 8271–8275 - PubMed
    1. Condeelis J, Singer RH (2005) How and why does beta-actin mRNA target? Biol Cell 97: 97–110 - PubMed

Publication types

MeSH terms