. 2006;7(3):R20.
doi: 10.1186/gb-2006-7-3-r20. Epub 2006 Mar 8.

Modulation of the transcription regulatory program in yeast cells committed to sporulation

Affiliations

Modulation of the transcription regulatory program in yeast cells committed to sporulation

Gilgi Friedlander et al. Genome Biol. 2006.

Abstract

Background: Meiosis in budding yeast is coupled to the process of sporulation, where the four haploid nuclei are packaged into a gamete. This differentiation process is characterized by a point of transition, termed commitment, when it becomes independent of the environment. Not much is known about the mechanisms underlying commitment, but it is often assumed that positive feedback loops stabilize the underlying gene-expression cascade.

Results: We describe the gene-expression program of committed cells. Sporulating cells were transferred back to growth medium at different stages of the process, and their transcription response was characterized. Most sporulation-induced genes were immediately downregulated upon transfer, even in committed cells that continued to sporulate. Focusing on the metabolic-related transcription response, we observed that pre-committed cells, as well as mature spores, responded to the transfer to growth medium in essentially the same way that vegetative cells responded to glucose. In contrast, committed cells elicited a dramatically different response.

Conclusion: Our results suggest that cells ensure commitment to sporulation not by stabilizing the process, but by modulating their gene-expression program in an active manner. This unique transcriptional program may optimize sporulation in an environment-specific manner.


Figures
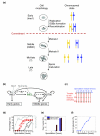
Figure 1
Figure 1
Experimental design. (a) Meiotic landmarks. The point of commitment is indicated. DSBs, double-strand breaks. (b) The regulatory network underlying the sporulation gene-expression program. Known interactions are shown. Arrows denote activation, and barred lines represent inhibition. Solid lines indicate regulation on the level of transcription while dashed lines indicate post-transcriptional regulation (for example, by protein phosphorylation). Transcription factors are shown in black and the kinase in green. The input of the cascade is shown in gray and scissors indicate degredation. IME2 activates middle gene expression, at least in part, by relieving Sum1-mediated repression of NDT80 [34]. (c) The experimental design. The sporulation process was initiated by transferring cells to sporulation medium. Cells were allowed to progress through the process for varying lengths of times, and were then transferred back to rich nutrient-containing medium. Each circle represents a time point at which genome-wide gene expression was monitored. (d) Temporal progression of sporulation. The percentages of cells that completed the first meiotic division (MI, triangles) or the second meiotic division (MII, circles) are shown in red, the percentage of asci in black and the recombination frequencies (Rec, determined by the frequency of His+ cells) in gray. CFU, colony-forming units. (e,f) Commitment to sporulation. (e) Cells were transferred to YPD at different stages of sporulation and were followed in YPD until 8 hours after sporulation initiation. The percentage of cells with four nuclei (determined by DAPI staining) before and after the transfer is shown. The time of transfer from sporulation medium (SPM) is indicated. (f) Cells were transferred from SPM to glucose solution (4%) at various times, as indicated. For each glucose culture, we calculated the fraction of cells that became spores, 24 hours after the initiation of the sporulation process (normalized by the sporulation efficiency at that experiment, which was 80%). Cells that were transferred early (before 5 hours in SPM) arrested in the cell cycle, as glucose alone does not support growth. At later times, cells continued the sporulation process and generated spores. Commitment occurs at around 5-6 hours in SPM.
Figure 2
Figure 2
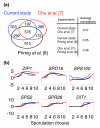
Comparison with previous studies. (a) Venn diagram comparing the genes induced during sporulation in our experiment and in two previous experiments [7,8]. A gene was defined as 'induced' at a particular time point, if its expression level at that time point was at least twofold higher than that of the pre-sporulation reference. All genes that were induced in at least one of the sporulation time points were considered (the area in the Venn diagram is proportional to the number of genes [63]). The average correlations between pairs of experiments are indicated (see Materials and methods for how correlations were calculated). (b) Examples of expression profiles for specific genes obtained in the current study (blue) and in the previous studies (red [7] and black [8]).
Figure 3
Figure 3
Transcriptional response of return to growth (RTG) cells. SPM, sporulation medium; YPD, growth medium. (a) The expression pattern of early sporulation (spo) genes (61 early I genes, as defined in [7]). Note the immediate repression of these genes upon transfer to growth medium (see Additional data file 3 for early genes defined according to the data presented in the current study; see Additional data file 5 for a matlab program that enables the reader to view the data in that format). (b) Expression pattern of IME1, the regulator of early-sporulation genes. (c) Expression pattern of the G1 cyclin gene, CLN3. In (a-c), expression patterns are shown as log2 ratios, and are color-coded for the log2 fold change according to the bar shown. (d) Polarized expression of genes associated with DNA repair and DNA recombination. The matrix of pairwise correlations between genes assigned to the GO groups 'DNA recombination' and 'DNA repair' is plotted. The genes were clustered according to similarity in their Pearson correlations, calculated on the basis of their expression patterns in our experiment (see Materials and methods). The average expression pattern of genes in each cluster is shown on the right. The first cluster include genes expressed during early sporulation, the second includes genes induced during middle sporulation, the third shows genes induced during RTG, and the fourth genes that are transiently induced on transfer to YPD and then repressed. The number of genes in each cluster is indicated above the arrow. Some of the genes in each cluster are indicated (for a full list of genes, and for a similar representation of additional gene classes, see Additional data files 22 and 33). Correlations are color-coded according to the bar shown.
Figure 4
Figure 4
Transcriptional response of committed cells. (a) Average expression of middle sporulation genes. The repressed group (245 genes) and the insulated group (24 genes) are shown. Note that downregulation of the repressed group is specific to YPD, and is not observed on transfer to YPA (which contains nitrogen and acetate) or glucose (4% solution). (b) Expression pattern of NDT80. Expression patterns in (a) and (b) are shown in log2 ratios, as in Figure 3, and log2 fold change in expressionis color-coded according to the bar. (c) A summary of the behavior of all sporulation-induced genes. All genes induced during sporulation were considered. A gene was defined as induced at a certain time point during sporulation if it was upregulated more than twofold in that time as well as in the previous and following hours. The induced genes were classified into three categories, depending on their behavior on transfer to YPD: repressed, induced, and insulated. The 'repressed' category included genes that were downregulated by at least 1.5-fold when transferred compared with their level during sporulation. Similarly, the 'induced' category included genes whose expression was upregulated by at least 1.5-fold on transfer. The 'insulated' group included the genes whose expression remained stable (did not change) upon the transfer (expression after transfer to YPD was less than 1.3-fold relative to sporulation).
Figure 5
Figure 5
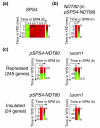
Response of mid-sporulation genes to YPD in pSPS4-NDT80 and Δsum1 strains. (a) Expression pattern of SPS4 in wild-type cells. (b) The expression of NDT80 in pSPS4-NDT80 cells. Cells were incubated for 5.5 hours in SPM, and were then transferred to YPD. Gene expression is shown at different time points following the transfer, as indicated. Note that a high level of NDT80 mRNA is maintained (compare with Figure 4b, note the different times). (c) The average expression of mid-sporulation genes in pSPS4-NDT80 and in Δsum1 strain. The repressed group (245 genes) and the insulated group (24 genes) are shown. Expression patterns in (a-c) are shown in log2 ratios, and are coded according to the colored bars.
Figure 6
Figure 6
The general metabolic response to glucose. (a) The matrix of pairwise correlations describing the similarity in the response of cells transferred to YPD at different stages of the process is shown. We also compared these responses with the response of vegetative cells and mature spores to YPD. Correlations were calculated on the basis of 936 genes whose expression is induced after the addition of glucose to vegetative cells (see Materials and methods and Additional data file 3). A similar correlation pattern was also observed on transfer to glucose solution (see Additional data file 2). (b-g) Expression patterns in log2 ratios of specific gene groups: (b) rRNA processing genes [64] (see Additional data file 3); (c) gluconeogenesis module [64] (see Additional data file 3); (d) ribosomal proteins module [64] (see Additional data file 3); (e) 'process-specific' group (see Additional data file 3). (f,g) A group of genes that is (f) upregulated (see Additional data file 3) or (g) downregulated on transfer to YPD specifically after commitment (see Additional data file 3). See Materials and methods for the identification of groups shown in (e-g). Each expression profile is accompanied by a colored bar indicating the log2 fold change.
Figure 7
Figure 7
Regulation of PKA in committed cells. (a) The PKA pathway. The addition of glucose to a non-fermenting yeast culture results in a rapid increase in the cellular level of cyclic AMP (cAMP, red circle), which binds to the regulatory subunit of PKA, thereby releasing and activating the catalytic subunits. Arrows indicate activation and barred lines indicate inhibition. (b) BCY1 expression. (c,d) The average expression of PKA-responsive genes. The average is over (c) 161 PKA-induced and (d) 314 PKA-repressed genes (identified by [35]). Each expression pattern is accompanied by a colored bar indicating the log2 fold change.

Similar articles

Cited by

References

    1. Kassir Y, Granot D, Simchen G. IME1, a positive regulator gene of meiosis in S. cerevisiae. Cell. 1988;52:853–862. doi: 10.1016/0092-8674(88)90427-8. - DOI - PubMed
    1. Shefer-Vaida M, Sherman A, Ashkenazi T, Robzyk K, Kassir Y. Positive and negative feedback loops affect the transcription of IME1, a positive regulator of meiosis in Saccharomyces cerevisiae. Dev Genet. 1995;16:219–228. doi: 10.1002/dvg.1020160302. - DOI - PubMed
    1. Rubin-Bejerano I, Mandel S, Robzyk K, Kassir Y. Induction of meiosis in Saccharomyces cerevisiae depends on conversion of the transcriptional represssor Ume6 to a positive regulator by its regulated association with the transcriptional activator Ime1. Mol Cell Biol. 1996;16:2518–2526. - PMC - PubMed
    1. Covitz PA, Mitchell AP. Repression by the yeast meiotic inhibitor RME1. Genes Dev. 1993;7:1598–1608. - PubMed
    1. Sagee S, Sherman A, Shenhar G, Robzyk K, Ben-Doy N, Simchen G, Kassir Y. Multiple and distinct activation and repression sequences mediate the regulated transcription of IME1, a transcriptional activator of meiosis-specific genes in Saccharomyces cerevisiae. Mol Cell Biol. 1998;18:1985–1995. - PMC - PubMed

Publication types

MeSH terms