Comparative Study
. 2006 Jun 1;573(Pt 2):343-56.
doi: 10.1113/jphysiol.2006.106906. Epub 2006 Mar 16.

Activity-dependent regulation of voltage-gated Na+ channel expression in Mat-LyLu rat prostate cancer cell line

Affiliations
Comparative Study

Activity-dependent regulation of voltage-gated Na+ channel expression in Mat-LyLu rat prostate cancer cell line

William J Brackenbury et al. J Physiol. .

Abstract

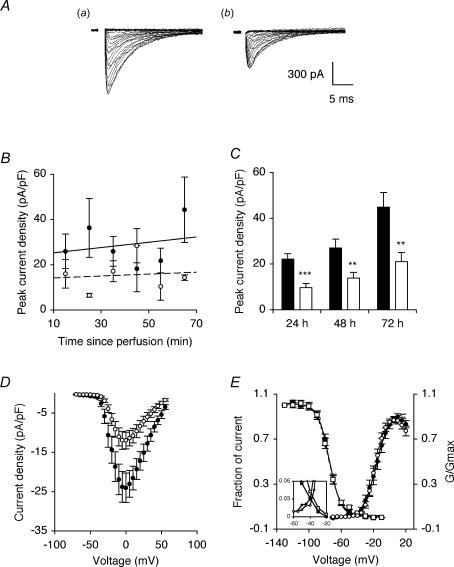
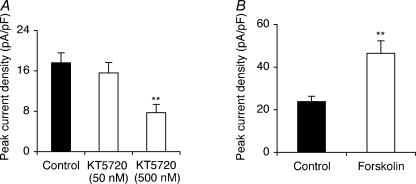
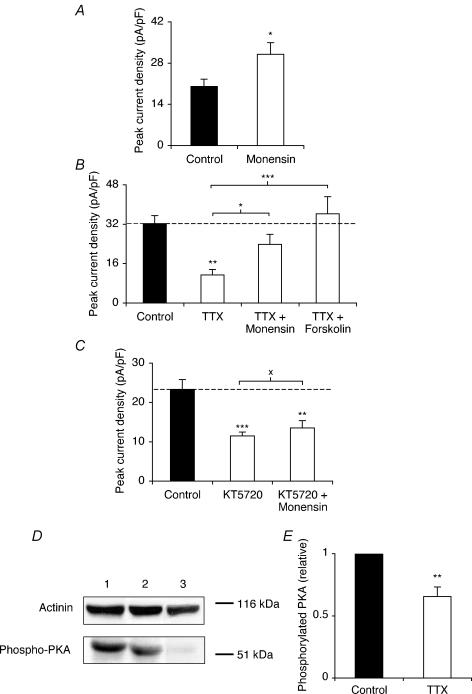
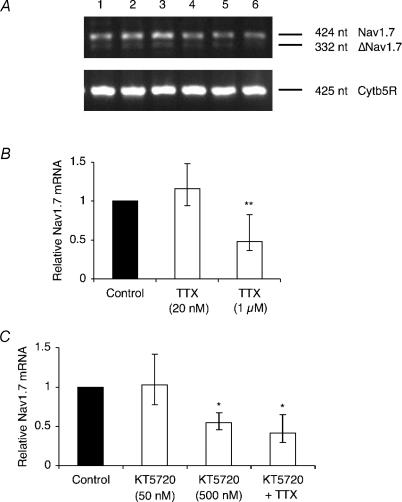
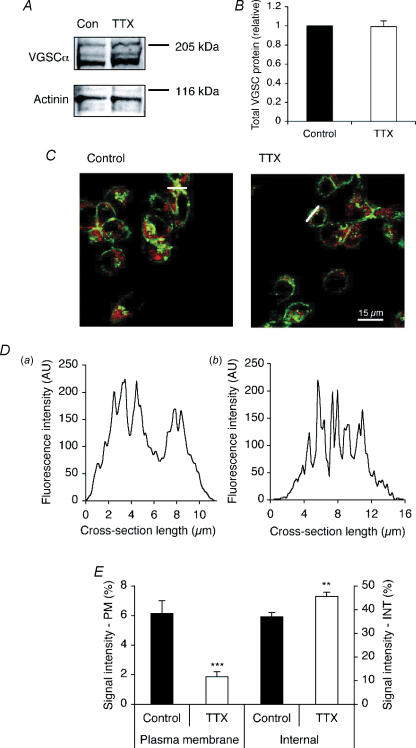
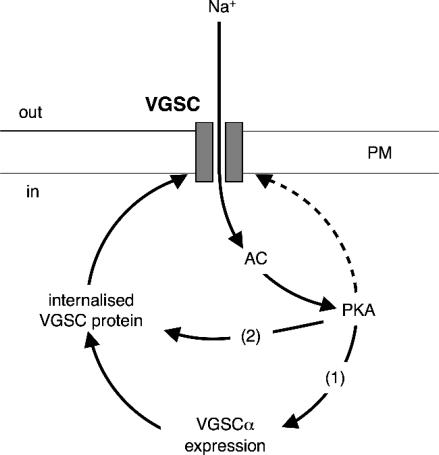
We have shown previously that voltage-gated Na(+) channels (VGSCs) are up-regulated in human metastatic disease (prostate, breast and small-cell lung cancers), and that VGSC activity potentiates metastatic cell behaviours. However, the mechanism(s) regulating functional VGSC expression in cancer cells remains unknown. We investigated the possibility of activity-dependent (auto)regulation of VGSC functional expression in the strongly metastatic Mat-LyLu model of rat prostate cancer. Pretreatment with tetrodotoxin (TTX) for 24-72 h subsequently suppressed peak VGSC current density without affecting voltage dependence. The hypothesis was tested that the VGSC auto-regulation occurred via VGSC-mediated Na(+) influx and subsequent activation of protein kinase A (PKA). Indeed, TTX pretreatment reduced the level of phosphorylated PKA, and the PKA inhibitor KT5720 decreased, whilst the adenylate cyclase activator forskolin and the Na(+) ionophore monensin both increased the peak VGSC current density. TTX reduced the mRNA level of Nav1.7, predominant in these cells, and VGSC protein expression at the plasma membrane, although the total VGSC protein level remained unchanged. TTX pretreatment eliminated the VGSC-dependent component of the cells' migration in Transwell assays. We concluded that the VGSC activity in Mat-LyLu rat prostate cancer cells was up-regulated in steady-state via a positive feedback mechanism involving PKA, and this enhanced the cells' migratory potential.


Figures

Figure 1
Figure 1. TTX pretreatment reduced peak VGSC current density
A, typical whole-cell VGSC currents elicited by 60 ms depolarizing voltage pulses between −70 mV and +70 mV applied from a holding potential of −100 mV: a, control cell; b, cell pretreated with 1 μm TTX for 48 h. B, peak VGSC current density of control cells and cells pretreated with 1 μm TTX for 48 h, recorded in sequential order, post perfusion of external bath medium. Control (continuous line; equation: y = 0.12x + 21.2) and TTX data (dotted line; equation: y = 0.04x + 13.8) are fitted with linear regressions. C, quantitative comparison of peak current densities recorded in control cells (filled bars), and cells pretreated with 1 μm TTX for 24–72 h (open bars). D, mean current–voltage relationships for control cells (•), and cells pretreated with 1 μm TTX for 48 h (○). E, mean availability–voltage (squares) and relative conductance (G/Gmax)–voltage relationships (circles) for control cells (filled symbols) and cells pretreated with 1 μm TTX for 48 h (open symbols). Control (continuous lines) and TTX data (dotted lines) are fitted with Boltzmann functions. The inset magnifies a window in which current is activated and not fully inactivated. Data are presented as means ± s.e.m. (n = 18 for all, except B: n = 4). Significance: **P < 0.01, ***P < 0.001.
Figure 2
Figure 2. KT5720 pretreatment reduced and forskolin pretreatment increased peak VGSC current density
A, quantitative comparison of peak current densities recorded in control cells and cells pretreated with KT5720 (50 or 500 nm) for 48 h. B, quantitative comparison of peak current densities recorded in control cells and cells pretreated with 50 μm forskolin for 48 h. Data are presented as means ± s.e.m. (n = 20). Significance: **P < 0.01, ***P < 0.001.
Figure 3
Figure 3. Monensin increased VGSC activity, and monensin and forskolin reversed the inhibiting effect of TTX pretreatment on VGSC activity
A, quantitative comparison of peak current densities recorded in control cells and cells pretreated with 10 nm monensin for 48 h. B, peak current densities recorded after pretreatment for 48 h in control conditions, or with TTX (1 μm) with or without monensin (10 nm) or forskolin (50 μm). C, peak current densities recorded after pretreatment for 48 h in control conditions, or with KT5720 (500 nm) with or without monensin (10 nm). D, Western blot with 60 μg of total protein per lane from control cells, cells treated with TTX (1 μm) for 48 h, and cells treated with KT5720 (500 nm) for 48 h, using a phosphorylated PKA antibody, and an actinin antibody for loading control. E, relative phosphorylated PKA level in control cells and cells treated with TTX (1 μm) for 48 h. Data are presented as means and s.e.m. (n = 20 for all, except E: n = 8). Significance: XP > 0.05, *P < 0.05, **P < 0.01, ***P < 0.001.
Figure 4
Figure 4. TTX and KT5720 reduced the Nav1.7 mRNA level
A, typical gel images of PCR products for Nav1.7 and cytochrome b5 reductase (Cytb5R). Lanes: 1, control; 2, pretreated for 48 h with TTX (20 nm); 3, TTX (1 μm); 4, KT5720 (50 nm); 5, KT5720 (500 nm); 6, KT5720 (500 nm) and TTX (1 μm). Δ denotes exon-skipped Nav1.7. B, relative Nav1.7 mRNA levels in control cells and cells treated for 48 h with TTX (20 nm or 1 μm). C, relative Nav1.7 mRNA levels in control cells and cells treated for 48 h with KT5720 (50 nm or 500 nm), or with KT5720 (500 nm) + TTX (1 μm). KT5720 (50 nm) bar is included here for completeness (complementing the data in Fig. 2A), but was not incorporated into the statistical analysis. Nav1.7 expression was normalized to Cytb5R by the 2−ΔΔCT method. Errors are propagated through the 2−ΔΔCT analysis (n = 3). Significance: *P < 0.05, **P < 0.01.
Figure 5
Figure 5. TTX did not affect the total VGSC protein level, but reduced the level of VGSC protein at the cell surface
A, Western blot with 60 μg of total protein per lane from cells treated with or without TTX (1 μm) for 48 h, using a pan-VGSC antibody, and an actinin antibody as a control for loading. B, relative total VGSC protein level in control cells and cells treated with TTX (1 μm) for 48 h. The VGSC α-subunit protein level was normalized to the actinin control. C, typical confocal images of control cells and cells treated with TTX for 48 h, double-immunolabelled with pan- VGSC antibody (red) and concanavalin A plasma membrane marker (green). White bars, cross-sections used for D. D, pan-VGSC immunofluorescence along cross-sections from a typical control cell (a), and cell treated with TTX (1 μm) for 48 h (b). AU, arbitrary unit. E, VGSC α-subunit protein distribution along subcellular cross-sections (%). Left-hand bars, 1.5 μm sections measured inward from edge of concanavalin A staining; right-hand bars, middle 30% of cross-section. PM, plasma membrane; INT, internal. Data are presented as means and s.e.m. (B, n = 5; E, n = 20). Significance: **P < 0.01, ***P < 0.001.
Figure 6
Figure 6. Pretreatment with TTX eliminated VGSC-dependent migration
The figure shows the number of cells migrating through a Transwell chamber over 7 h. Bar labels: 1, control pretreated cells; 2, cells pretreated with TTX (1 μm) for 48 h; 3, control pretreated cells migrated in presence of TTX (1 μm); 4, cells pretreated with TTX and then migrated in presence of TTX. Data are presented as means and s.e.m. Significance: XP > 0.05; *P < 0.05; n = 4.
Figure 7
Figure 7. A basic model of activity-dependent, steady-state regulation of functional VGSC expression in Mat-LyLu cells by positive feedback (continuous lines)
Influx of Na+ through VGSCs results in activation of AC and PKA. PKA can have multiple effects on VGSC expression in plasma membrane (PM): (1) potentiation of de novo VGSC synthesis via transcription; and (2) increased trafficking of VGSC protein to the plasma membrane. In addition, PKA can directly phosphorylate surface-expressed VGSCs (dashed line), although this may be independent of Na+.

References

    1. Abdul M, Hoosein N. Inhibition by anticonvulsants of prostate-specific antigen and interleukin-6 secretion by human prostate cancer cells. Anticancer Res. 2001;21:2045–2048. - PubMed
    1. Abdul M, Hoosein N. Voltage-gated sodium ion channels in prostate cancer: expression and activity. Anticancer Res. 2002;22:1727–1730. - PubMed
    1. Allen DH, Lepple-Wienhues A, Cahalan MD. Ion channel phenotype of melanoma cell lines. J Membr Biol. 1997;155:27–34. - PubMed
    1. Anderson JD, Hansen TP, Lenkowski PW, Walls AM, Choudhury IM, Schenck HA, Friehling M, Holl GM, Patel MK, Sikes RA, Brown ML. Voltage-gated sodium channel blockers as cytostatic inhibitors of the androgen-independent prostate cancer cell line PC-3. Mol Cancer Ther. 2003;2:1149–1154. - PubMed
    1. Ben Fredj N, Grange J, Sadoul R, Richard S, Goldberg Y, Boyer V. Depolarization-induced translocation of the RNA-binding protein Sam68 to the dendrites of hippocampal neurons. J Cell Sci. 2004;117:1079–1090. - PubMed

Publication types