

Analysis of transitions at two-fold redundant sites in mammalian genomes. Transition redundant approach-to-equilibrium (TREx) distance metrics
- PMID: 16545144
- PMCID: PMC1435776
- DOI: 10.1186/1471-2148-6-25
Analysis of transitions at two-fold redundant sites in mammalian genomes. Transition redundant approach-to-equilibrium (TREx) distance metrics
Abstract
Background: The exchange of nucleotides at synonymous sites in a gene encoding a protein is believed to have little impact on the fitness of a host organism. This should be especially true for synonymous transitions, where a pyrimidine nucleotide is replaced by another pyrimidine, or a purine is replaced by another purine. This suggests that transition redundant exchange (TREx) processes at the third position of conserved two-fold codon systems might offer the best approximation for a neutral molecular clock, serving to examine, within coding regions, theories that require neutrality, determine whether transition rate constants differ within genes in a single lineage, and correlate dates of events recorded in genomes with dates in the geological and paleontological records. To date, TREx analysis of the yeast genome has recognized correlated duplications that established a new metabolic strategies in fungi, and supported analyses of functional change in aromatases in pigs. TREx dating has limitations, however. Multiple transitions at synonymous sites may cause equilibration and loss of information. Further, to be useful to correlate events in the genomic record, different genes within a genome must suffer transitions at similar rates.
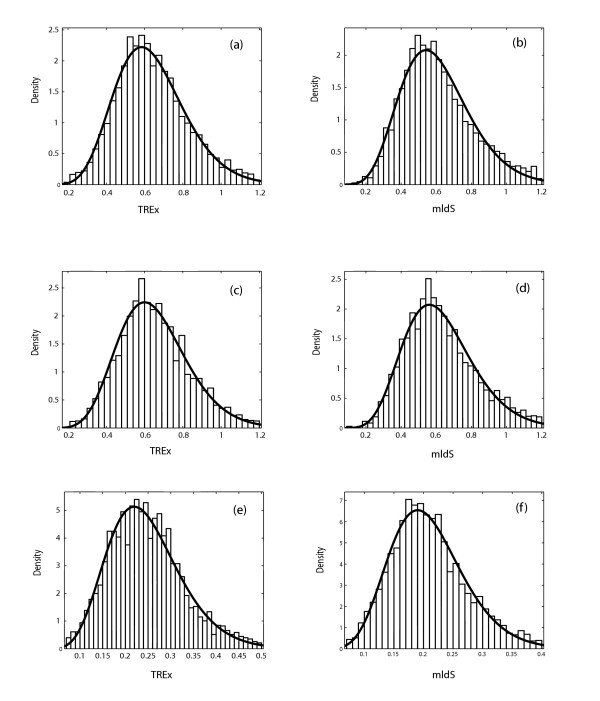
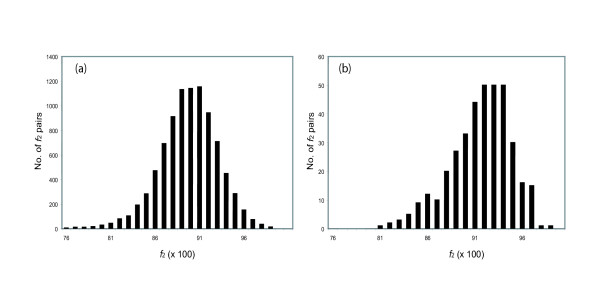
Results: A formalism to analyze divergence at two fold redundant codon systems is presented. This formalism exploits two-state approach-to-equilibrium kinetics from chemistry. This formalism captures, in a single equation, the possibility of multiple substitutions at individual sites, avoiding any need to "correct" for these. The formalism also connects specific rate constants for transitions to specific approximations in an underlying evolutionary model, including assumptions that transition rate constants are invariant at different sites, in different genes, in different lineages, and at different times. Therefore, the formalism supports analyses that evaluate these approximations. Transitions at synonymous sites within two-fold redundant coding systems were examined in the mouse, rat, and human genomes. The key metric (f2), the fraction of those sites that holds the same nucleotide, was measured for putative ortholog pairs. A transition redundant exchange (TREx) distance was calculated from f2 for these pairs. Pyrimidine-pyrimidine transitions at these sites occur approximately 14% faster than purine-purine transitions in various lineages. Transition rate constants were similar in different genes within the same lineages; within a set of orthologs, the f2 distribution is only modest overdispersed. No correlation between disparity and overdispersion is observed. In rodents, evidence was found for greater conservation of TREx sites in genes on the X chromosome, accounting for a small part of the overdispersion, however.
Conclusion: The TREx metric is useful to analyze the history of transition rate constants within these mammals over the past 100 million years. The TREx metric estimates the extent to which silent nucleotide substitutions accumulate in different genes, on different chromosomes, with different compositions, in different lineages, and at different times.
Figures


Similar articles
-
Functional conservation of nucleosome formation selectively biases presumably neutral molecular variation in yeast genomes.Genome Biol Evol. 2011;3:15-22. doi: 10.1093/gbe/evq081. Epub 2010 Dec 6. Genome Biol Evol. 2011. PMID: 21135411 Free PMC article.
-
DNA sequence evolution: the sounds of silence.Philos Trans R Soc Lond B Biol Sci. 1995 Sep 29;349(1329):241-7. doi: 10.1098/rstb.1995.0108. Philos Trans R Soc Lond B Biol Sci. 1995. PMID: 8577834 Review.
-
[Analysis, identification and correction of some errors of model refseqs appeared in NCBI Human Gene Database by in silico cloning and experimental verification of novel human genes].Yi Chuan Xue Bao. 2004 May;31(5):431-43. Yi Chuan Xue Bao. 2004. PMID: 15478601 Chinese.
-
Mammalian gene evolution: nucleotide sequence divergence between mouse and rat.J Mol Evol. 1993 Oct;37(4):441-56. doi: 10.1007/BF00178874. J Mol Evol. 1993. PMID: 8308912
-
Folic acid supplementation and malaria susceptibility and severity among people taking antifolate antimalarial drugs in endemic areas.Cochrane Database Syst Rev. 2022 Feb 1;2(2022):CD014217. doi: 10.1002/14651858.CD014217. Cochrane Database Syst Rev. 2022. PMID: 36321557 Free PMC article.
Cited by
-
The natural history of class I primate alcohol dehydrogenases includes gene duplication, gene loss, and gene conversion.PLoS One. 2012;7(7):e41175. doi: 10.1371/journal.pone.0041175. Epub 2012 Jul 31. PLoS One. 2012. PMID: 22859968 Free PMC article.
References
-
- Li WH, Wu CI, Luo CC. A new method for estimating synonymous and nonsynonymous rates of nucleotide substitution considering the relative likelihood of nucleotide and codon changes. Mol Biol Evol. 1985;2:150–174. - PubMed
-
- Nei M, Gojobori T. Simple methods for estimating the numbers of synonymous and nonsynonymous nucleotide substitutions. Mol Biol Evol. 1986;3:418–426. - PubMed
Publication types
MeSH terms
Grants and funding
LinkOut - more resources
Full Text Sources
Molecular Biology Databases
Miscellaneous
