. 2006 May 5;343(2):351-60.
doi: 10.1016/j.bbrc.2006.02.181. Epub 2006 Mar 10.

Nanosecond pulsed electric fields cause melanomas to self-destruct

Affiliations

Nanosecond pulsed electric fields cause melanomas to self-destruct

Richard Nuccitelli et al. Biochem Biophys Res Commun. .

Abstract

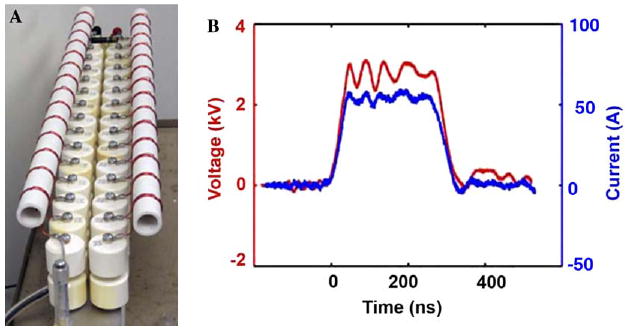
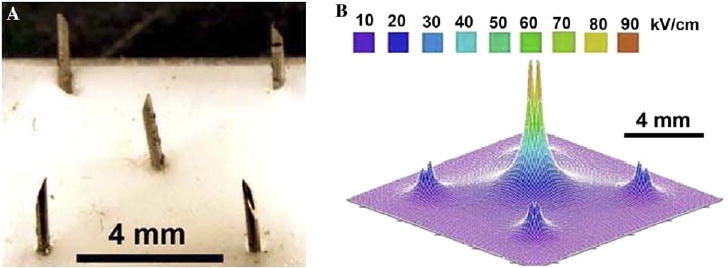
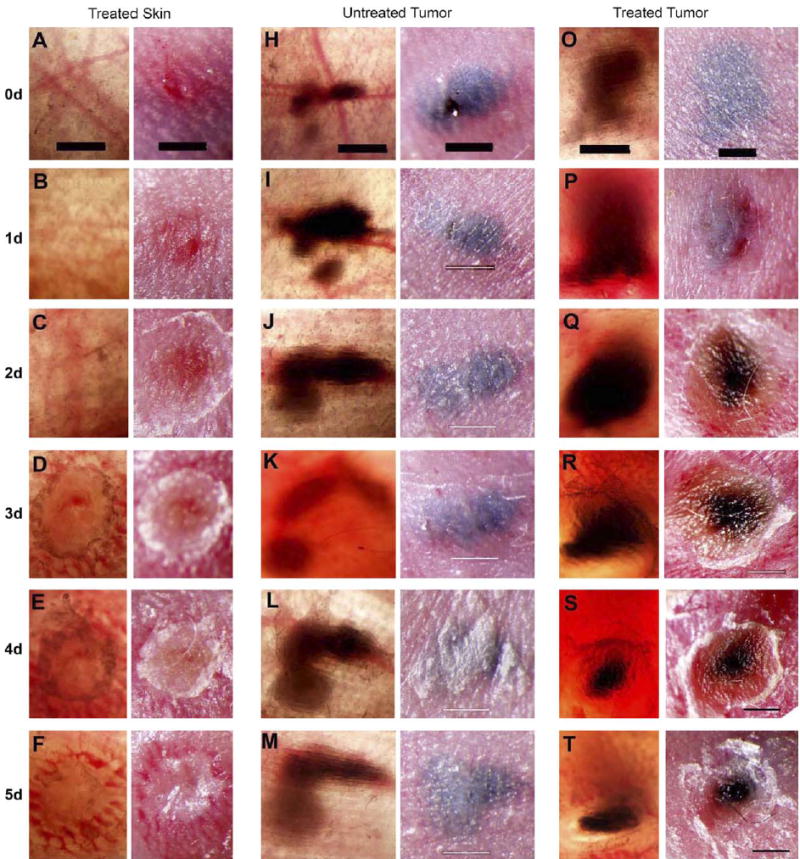
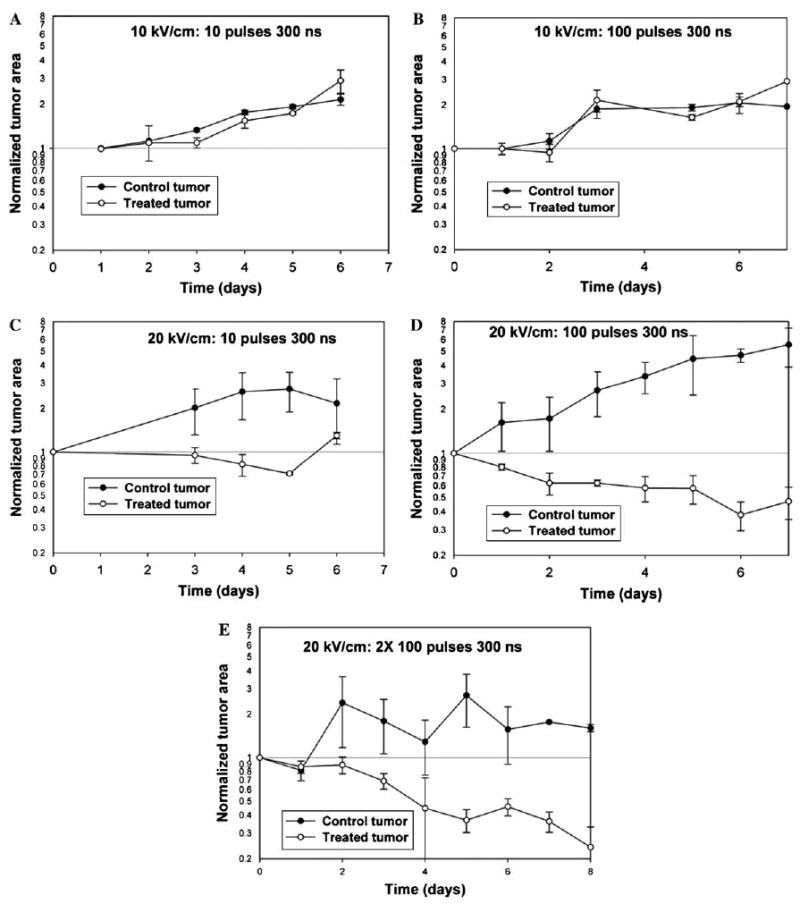
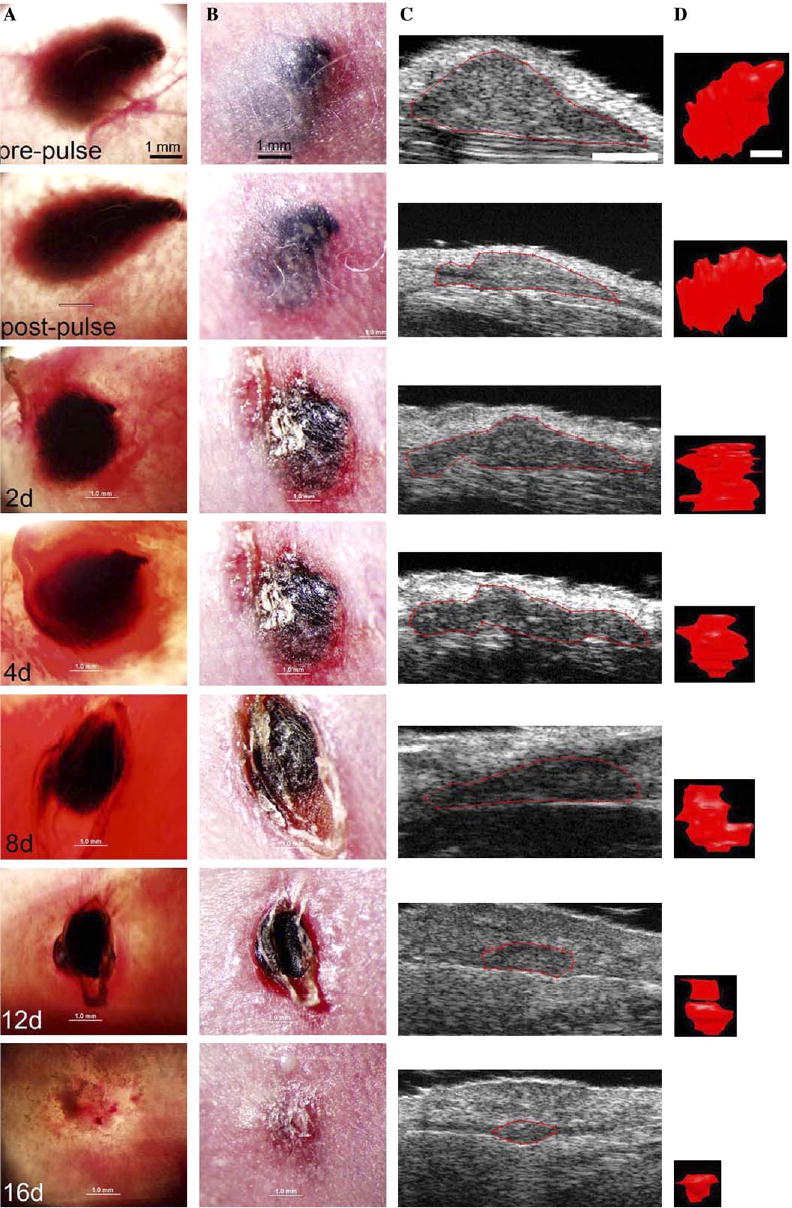
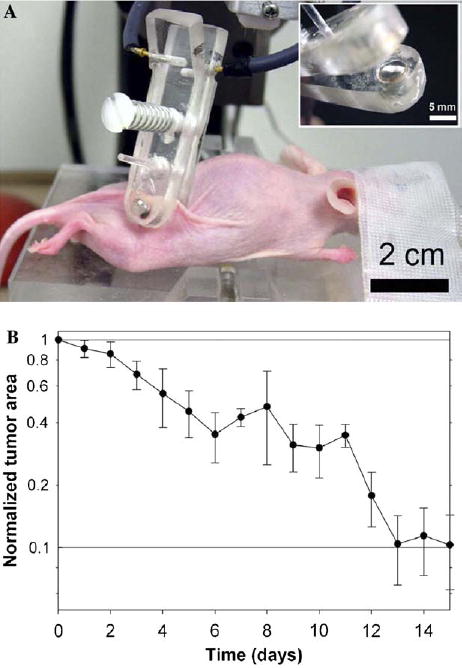
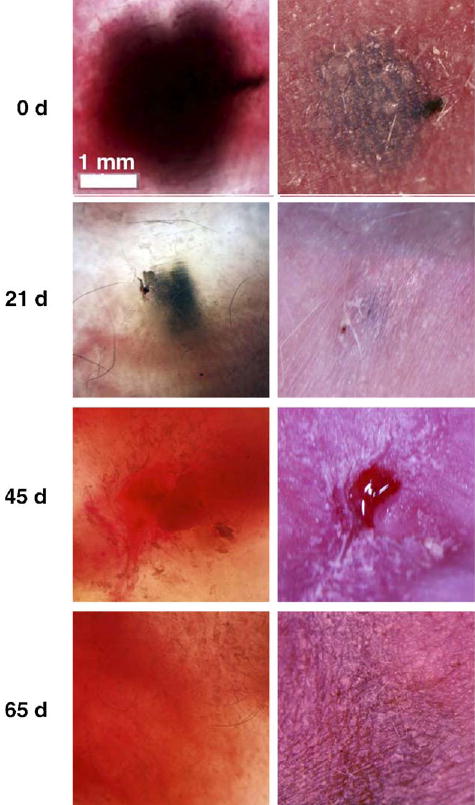
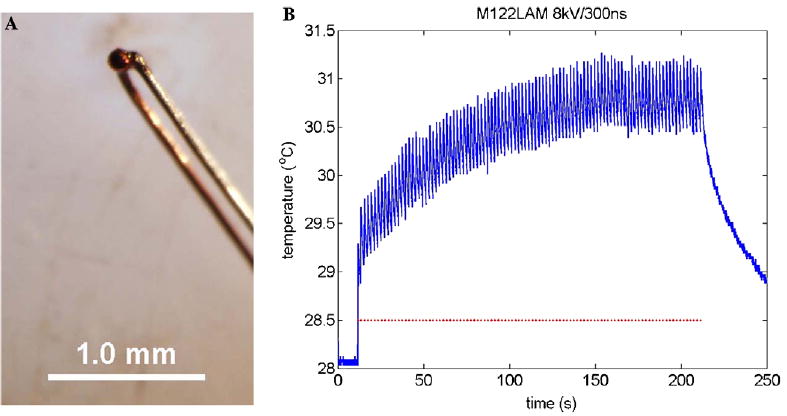
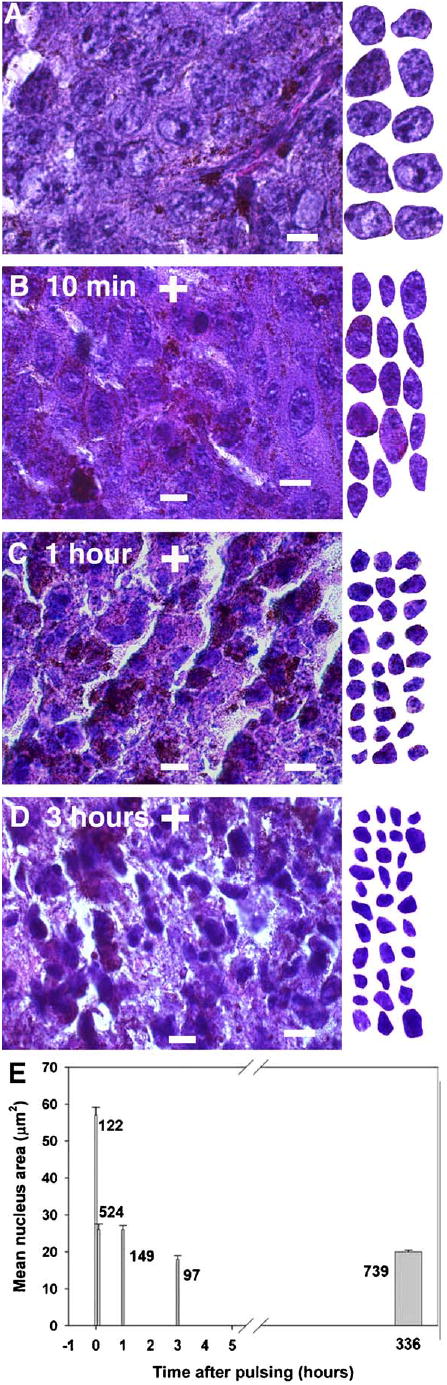
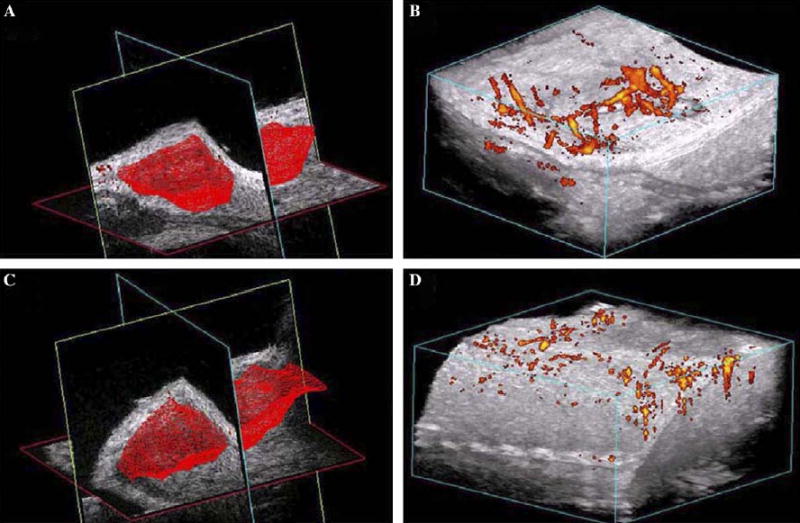
We have discovered a new, drug-free therapy for treating solid skin tumors. Pulsed electric fields greater than 20 kV/cm with rise times of 30 ns and durations of 300 ns penetrate into the interior of tumor cells and cause tumor cell nuclei to rapidly shrink and tumor blood flow to stop. Melanomas shrink by 90% within two weeks following a cumulative field exposure time of 120 micros. A second treatment at this time can result in complete remission. This new technique provides a highly localized targeting of tumor cells with only minor effects on overlying skin. Each pulse deposits 0.2 J and 100 pulses increase the temperature of the treated region by only 3 degrees C, ten degrees lower than the minimum temperature for hyperthermia effects.


Figures

Fig. 1
Fig. 1
Pulse generator used in these experiments. (A) Three hundred nanosecond pulse-forming network in Blumlein configuration. Width of each ceramic capacitor is 3 cm. (B) Typical voltage (red or solid trace) and current (blue or dashed trace) pulse generated across a tumor (for interpretation of the reference to color in this figure legend, the reader is referred to the web version of this paper).
Fig. 2
Fig. 2
Needle array electrode and electric field pattern. (A) Photograph of 5-needle array used for the first experiments. (B) 3-D plot of the electric field generated when 8 kV is placed on the center electrode and the outer four electrodes are held at ground.
Fig. 3
Fig. 3
Typical response of skin and melanoma to one or two applications of 100 pulses using a 5-needle array electrode on mouse #56. Each matched pair of photographs represents an in vivo transillumination of the skin on the left and a surface view on the right. Numbers on the far left indicate the number of days after pulsing at which all three matched pairs to the right were photographed. (A–F) The typical response of normal skin to 100 pulses (300 ns long, 20 kV/cm, 0.5 Hz) delivered on day 0. Small superficial erosion in (B) grows in (C–E) and indicates loss of some or all epidermis. (H–M) The electrode array was inserted into this tumor on day 0 but no pulses were delivered. (O–T) One hundred pulses (300 ns long, 20 kV/cm) were delivered at 0.5 Hz on day 0 and day 1. Necrosis evident on day two becomes more intense over time. Scale bars (A–T) 1 mm and all photographs in a given row are at the same magnification.
Fig. 4
Fig. 4
Summary of the size changes in a total of 23 melanomas after the indicated treatments using the 5-needle array. For each day the tumor area was measured from the transillumination image and divided by that measured on day zero to give the normalized area. The average response of two to three tumors from different animals is plotted on a logarithmic scale and the error bars represent the SEM. Pulses were applied at a frequency of 0.5 Hz. (A, B) 4 kV was applied between center and outer needles spaced 4 mm apart to give an average field of 10 kV/cm. (C–E) Eight kilovolt was applied between the center and outer needles to give an average field of 20 kV/cm.
Fig. 5
Fig. 5
Typical response of a melanoma to three applications of 100 pulses (300 ns, 40 kV/cm, 0.5 Hz) 30 min apart on day 0 followed by a single application on day 4 using a 5 mm diameter parallel plate electrode on mouse #102. Collection of seven matched sets of images of the same tumor all taken on the day indicated in the lower left corner of the transillumination image. (Column A) Transillumination image. (Column B) Surface view. (Column C) Ultrasound slice at center of tumor; (column D) 3-D reconstruction made from 100 serial ultrasound slices through tumor. Magnification is constant for each column and scale bar at top of each column represents 1 mm.
Fig. 6
Fig. 6
(A) Photograph of SKH-1 hairless mouse being treated with parallel plate electrode under isoflurane inhalation anesthesia. (Inset) Close-up of one of the plates of parallel plate electrode showing it recessed by 0.5 mm to allow a space for a conductive agar gel to be placed on it. (B) Mean change in normalized area of the transillumination image of six tumors from three mice treated with parallel plate electrodes using the same 4 × 100 pulse applications (3 × 100 on day 0 and 1 × 100 on day 4). 40–80 kV/cm, 300 ns pulses at 0.5 Hz. Error bars indicate the SEM.
Fig. 7
Fig. 7
Complete regression of melanoma evident by 65 days after the first treatment. One hundred pulses of 300 ns and 40 kV/cm were applied on days 0, 1, 2 and 21, 22, 23. Each pair of photographs were taken on the day indicated at the left; transillumination on left and surface view on right. The scale bar in upper left represents 1 mm and is the same for all images.
Fig. 8
Fig. 8
Measurement of the temperature within a melanoma during nsPEF application. (A) Micrograph of a thermocouple made by fusing a copper wire with one made from constantine. (B) Temperature record from a thermocouple positioned inside of a melanoma during pulse application. Lower dots indicate the time that each pulse was applied.
Fig. 9
Fig. 9
Targets and mechanisms of nsPEF effects. (A–D) Seven micrometer thick paraffin sections of control and treated melanomas fixed at the indicated time after treatment with 100 pulses (300 ns, 40 kV/cm, 0.5 Hz) stained with hematoxylin and eosin. The clearest nuclei were copied and placed to the right of each section to assist in size comparison. (A) Control tumor section; (B) 10 min post-treatment (C) 1 h post-treatment. (D) Three hours post-treatment. Scale bars: 10 μm. (E) Mean nuclear area versus time after 100–200 pulses were applied. Number of cell nuclei measured from at least two mice for each time point indicated next to each column and bars represent SEM. Breakin time is 330 h. There is a significant difference between the 0 h prepulse control and all of the other time points (p < 0.001) as well as between 1 and 3 h (p < 0.001). There is no significant difference between 0.1 and 1 h. Scale bars in (A)–(D): 10 μm.
Fig. 10
Fig. 10
Blood flow in melanoma before and after nsPEF application. (A) 3-D reconstruction of volume of melanoma; (B) power Doppler reconstruction of blood flow before field application. (C) 3-D reconstruction of volume of the same melanoma shown in (A) generated about 15 min after 100 pulses (300 ns, 40 kV/cm, 0.5 Hz). (D) Power Doppler reconstruction of blood flow in the same tumor shown in (B) generated about 15 min after 100 pulses (300 ns, 40 kV/cm, 0.5 Hz).

References

    1. Tanabe KK, Curley SA, Dodd GD, Siperstein AE, Goldberg SN. Radiofrequency ablation: the experts weigh in. Cancer. 2004;100:641–650. - PubMed
    1. Haemmerich D, Laeseke PF. Thermal tumour ablation: devices, clinical applications and future directions. Int J Hyperthermia. 2005;21:755–760. - PubMed
    1. Lucas ML, Heller R. IL-12 gene therapy using an electrically mediated nonviral approach reduces metastatic growth of melanoma DNA. Cell Biol. 2003;22:755–763. - PubMed
    1. Kubota Y, Tomita Y, Tsukigi M, Kurachi H, Motoyama T, Mir LM. A case of perineal malignant melanoma successfully treated with electrochemotherapy. Melanoma Res. 2005;15:133–134. - PubMed
    1. Gothelf A, Mir LM, Gehl J. Electrochemotherapy: results of cancer treatment using enhanced delivery of bleomycin by electroporation. Cancer Treat Rev. 2003;29:371–387. - PubMed

Publication types