

A second-generation integrated map of the silkworm reveals synteny and conserved gene order between lepidopteran insects
- PMID: 16547103
- PMCID: PMC1526672
- DOI: 10.1534/genetics.106.055541
A second-generation integrated map of the silkworm reveals synteny and conserved gene order between lepidopteran insects
Erratum in
- Genetics. 2008 Mar;178(3):1837
Abstract
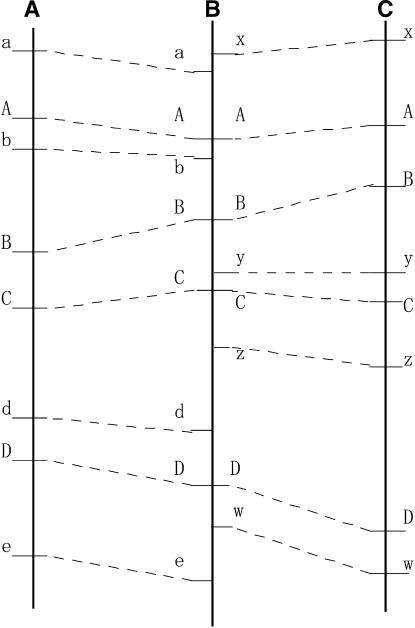
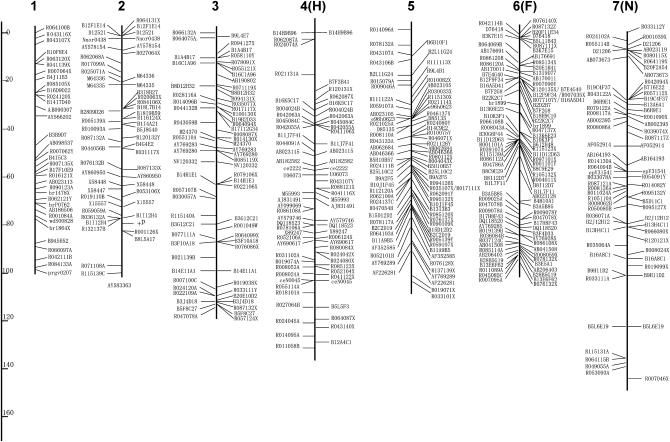
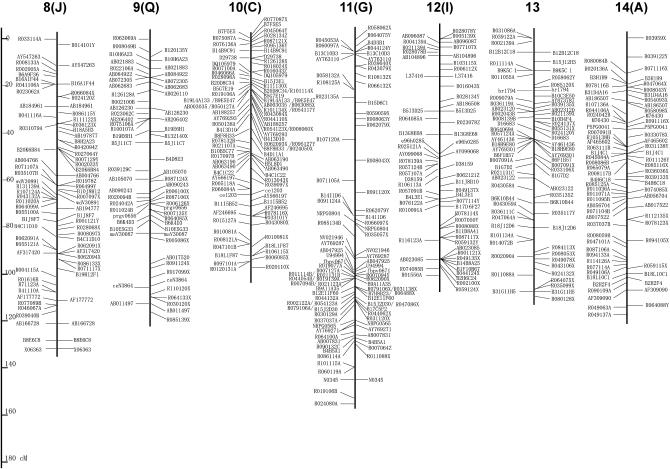
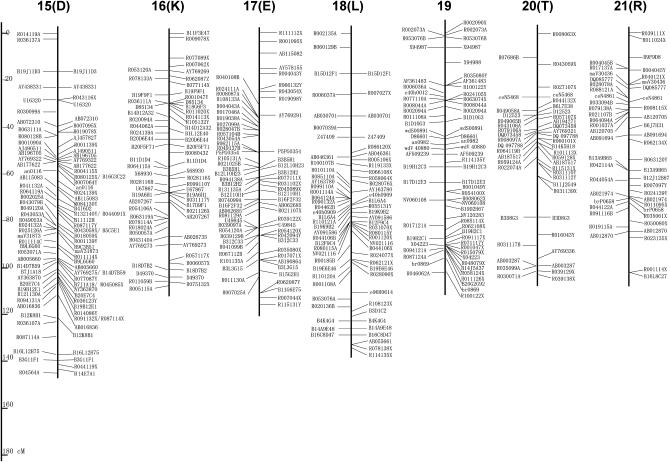
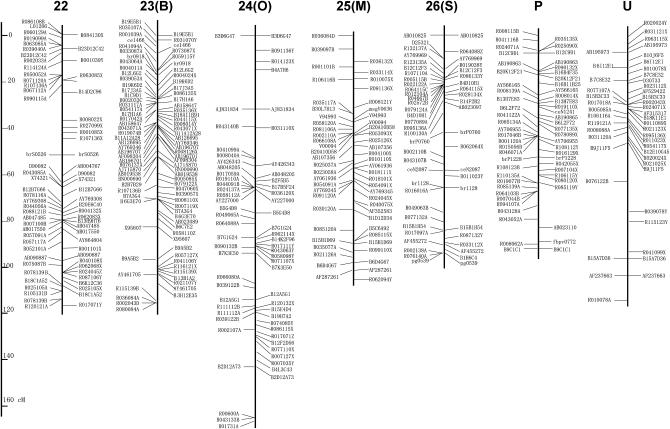
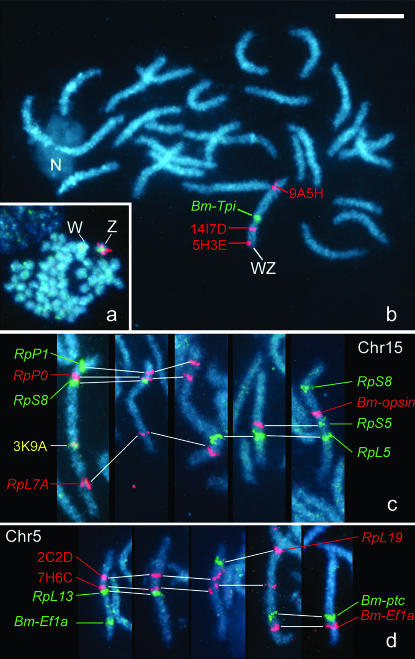
A second-generation linkage map was constructed for the silkworm, Bombyx mori, focusing on mapping Bombyx sequences appearing in public nucleotide databases and bacterial artificial chromosome (BAC) contigs. A total of 874 BAC contigs containing 5067 clones (22% of the library) were constructed by PCR-based screening with sequence-tagged sites (STSs) derived from whole-genome shotgun (WGS) sequences. A total of 523 BAC contigs, including 342 independent genes registered in public databases and 85 expressed sequence tags (ESTs), were placed onto the linkage map. We found significant synteny and conserved gene order between B. mori and a nymphalid butterfly, Heliconius melpomene, in four linkage groups (LGs), strongly suggesting that using B. mori as a reference for comparative genomics in Lepidotera is highly feasible.
Figures
Similar articles
-
Conserved synteny of genes between chromosome 15 of Bombyx mori and a chromosome of Manduca sexta shown by five-color BAC-FISH.Genome. 2007 Nov;50(11):1061-5. doi: 10.1139/g07-082. Genome. 2007. PMID: 18059551
-
Extensive conserved synteny of genes between the karyotypes of Manduca sexta and Bombyx mori revealed by BAC-FISH mapping.PLoS One. 2009 Oct 15;4(10):e7465. doi: 10.1371/journal.pone.0007465. PLoS One. 2009. PMID: 19829706 Free PMC article.
-
A BAC-based integrated linkage map of the silkworm Bombyx mori.Genome Biol. 2008 Jan 28;9(1):R21. doi: 10.1186/gb-2008-9-1-r21. Genome Biol. 2008. PMID: 18226216 Free PMC article.
-
The genetics and genomics of the silkworm, Bombyx mori.Annu Rev Entomol. 2005;50:71-100. doi: 10.1146/annurev.ento.50.071803.130456. Annu Rev Entomol. 2005. PMID: 15355234 Review.
-
[Cytogenetics and application in domesticated silkworm Bombyx mori].Yi Chuan. 2006 Sep;28(9):1167-72. doi: 10.1360/yc-006-1167. Yi Chuan. 2006. PMID: 16963430 Review. Chinese.
Cited by
-
Identification, analysis, and linkage mapping of expressed sequence tags from the Australian sheep blowfly.BMC Genomics. 2011 Aug 10;12:406. doi: 10.1186/1471-2164-12-406. BMC Genomics. 2011. PMID: 21827708 Free PMC article.
-
A FISH-based chromosome map for the European corn borer yields insights into ancient chromosomal fusions in the silkworm.Heredity (Edinb). 2016 Jan;116(1):75-83. doi: 10.1038/hdy.2015.72. Epub 2015 Aug 12. Heredity (Edinb). 2016. PMID: 26264548 Free PMC article.
-
Evolutionary dynamics of rDNA clusters on chromosomes of moths and butterflies (Lepidoptera).Genetica. 2010 Mar;138(3):343-354. doi: 10.1007/s10709-009-9424-5. Genetica. 2010. PMID: 19921441
-
Construction and sequence sampling of deep-coverage, large-insert BAC libraries for three model lepidopteran species.BMC Genomics. 2009 Jun 26;10:283. doi: 10.1186/1471-2164-10-283. BMC Genomics. 2009. PMID: 19558662 Free PMC article.
-
The Glanville fritillary genome retains an ancient karyotype and reveals selective chromosomal fusions in Lepidoptera.Nat Commun. 2014 Sep 5;5:4737. doi: 10.1038/ncomms5737. Nat Commun. 2014. PMID: 25189940 Free PMC article.
References
-
- Banno, Y., H. Fujii, Y. Kawaguchi, K. Yamamoto, K. Nishikawa et al., 2005. A Guide to the Silkworm Mutants 2005: Gene Name and Gene Symbol. Institute of Genetic Resources, Kyushu University, Fukuoka, Japan
-
- Cheng, T. C., Q. Y. Xia, J. F. Qian, C. Liu, Y. Lin et al., 2004. Mining single nucleotide polymorphisms from EST data of silkworm, Bombyx mori, inbred strain Dazao. Insect Biochem. Mol. Biol. 34: 523–530. - PubMed
-
- Goldsmith, M. R., T. Shimada and H. Abe, 2004. The genetics and genomics of the silkworm, Bombyx mori. Annu. Rev. Entomol. 50: 71–100. - PubMed
Publication types
MeSH terms
Substances
LinkOut - more resources
Full Text Sources
Research Materials
