

Effect of varying epistasis on the evolution of recombination
- PMID: 16547114
- PMCID: PMC1526506
- DOI: 10.1534/genetics.105.053108
Effect of varying epistasis on the evolution of recombination
Abstract
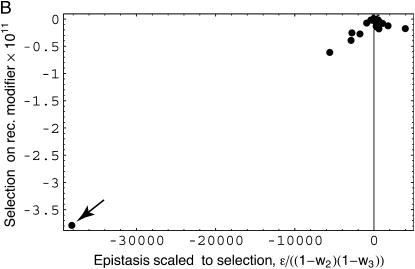
Whether recombination decelerates or accelerates a population's response to selection depends, at least in part, on how fitness-determining loci interact. Realistically, all genomes likely contain fitness interactions both with positive and with negative epistasis. Therefore, it is crucial to determine the conditions under which the potential beneficial effects of recombination with negative epistasis prevail over the detrimental effects of recombination with positive epistasis. Here, we examine the simultaneous effects of diverse epistatic interactions with different strengths and signs in a simplified model system with independent pairs of interacting loci and selection acting only on the haploid phase. We find that the average form of epistasis does not predict the average amount of linkage disequilibrium generated or the impact on a recombination modifier when compared to results using the entire distribution of epistatic effects and associated single-mutant effects. Moreover, we show that epistatic interactions of a given strength can produce very different effects, having the greatest impact when selection is weak. In summary, we observe that the evolution of recombination at mutation-selection balance might be driven by a small number of interactions with weak selection rather than by the average epistasis of all interactions. We illustrate this effect with an analysis of published data of Saccharomyces cerevisiae. Thus to draw conclusions on the evolution of recombination from experimental data, it is necessary to consider the distribution of epistatic interactions together with the associated selection coefficients.
Figures


Similar articles
-
Effect of epistasis and linkage on fixation probability in three-locus models: an ancestral recombination-selection graph approach.Theor Popul Biol. 2012 Sep;82(2):131-45. doi: 10.1016/j.tpb.2012.05.002. Epub 2012 May 23. Theor Popul Biol. 2012. PMID: 22634384
-
Deleterious mutations, variable epistatic interactions, and the evolution of recombination.Theor Popul Biol. 1997 Apr;51(2):134-47. doi: 10.1006/tpbi.1997.1301. Theor Popul Biol. 1997. PMID: 9169238 Review.
-
The evolution of recombination in a heterogeneous environment.Genetics. 2000 Sep;156(1):423-38. doi: 10.1093/genetics/156.1.423. Genetics. 2000. PMID: 10978305 Free PMC article.
-
Fitness epistasis among 6 biosynthetic loci in the budding yeast Saccharomyces cerevisiae.J Hered. 2010 Mar-Apr;101 Suppl 1:S75-84. doi: 10.1093/jhered/esq007. Epub 2010 Mar 1. J Hered. 2010. PMID: 20194517
-
Epistasis between deleterious mutations and the evolution of recombination.Trends Ecol Evol. 2007 Jun;22(6):308-15. doi: 10.1016/j.tree.2007.02.014. Epub 2007 Mar 6. Trends Ecol Evol. 2007. PMID: 17337087 Review.
Cited by
-
Modeling multiple infection of cells by viruses: Challenges and insights.Math Biosci. 2015 Jun;264:21-8. doi: 10.1016/j.mbs.2015.03.001. Epub 2015 Mar 10. Math Biosci. 2015. PMID: 25770053 Free PMC article.
-
Fitness ranking of individual mutants drives patterns of epistatic interactions in HIV-1.PLoS One. 2011 Mar 31;6(3):e18375. doi: 10.1371/journal.pone.0018375. PLoS One. 2011. PMID: 21483787 Free PMC article.
-
Expression profiles reveal parallel evolution of epistatic interactions involving the CRP regulon in Escherichia coli.PLoS Genet. 2008 Feb;4(2):e35. doi: 10.1371/journal.pgen.0040035. PLoS Genet. 2008. PMID: 18282111 Free PMC article.
-
Understanding the evolution of multiple drug resistance in structured populations.Elife. 2021 Jun 1;10:e65645. doi: 10.7554/eLife.65645. Elife. 2021. PMID: 34061029 Free PMC article.
-
Epistasis detectably alters correlations between genomic sites in a narrow parameter window.PLoS One. 2019 May 31;14(5):e0214036. doi: 10.1371/journal.pone.0214036. eCollection 2019. PLoS One. 2019. PMID: 31150393 Free PMC article.
References
-
- Barton, N., 1995. A general model for the evolution of recombination. Genet. Res. 65: 123–145. - PubMed
-
- Bonhoeffer, S., C. Chappey, N. Parkin, J. Whitcomb and C. Petropoulos, 2004. Evidence for positive epistasis in HIV-1. Science 306: 1547–1550. - PubMed
-
- de la Peña, M., S. Elena and A. Moya, 2000. Effect of deleterious mutation-accumulation on the fitness of RNA bacteriophage MS2. Evol. Int. J. Org. Evol. 54: 686–691. - PubMed
-
- Elena, S., 1999. Little evidence for synergism among deleterious mutations in a nonsegmented RNA virus. J. Mol. Evol. 49: 703–707. - PubMed
Publication types
MeSH terms
LinkOut - more resources
Full Text Sources
Molecular Biology Databases
