. 2006 Mar 28;103(13):4808-12.
doi: 10.1073/pnas.0510945103. Epub 2006 Mar 17.

Ionic contrast terahertz near-field imaging of axonal water fluxes

Affiliations

Ionic contrast terahertz near-field imaging of axonal water fluxes

Jean-Baptiste Masson et al. Proc Natl Acad Sci U S A. .

Erratum in

  • Proc Natl Acad Sci U S A. 2007 May 22;104(21):9099

Abstract

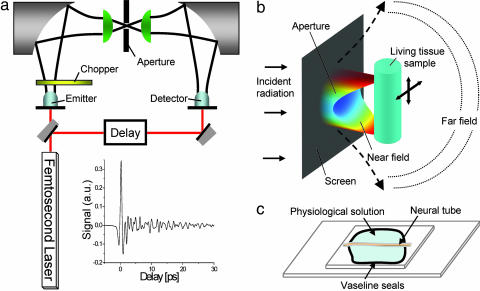
We demonstrate the direct and noninvasive imaging of functional neurons by ionic contrast terahertz near-field microscopy. This technique provides quantitative measurements of ionic concentrations in both the intracellular and extracellular compartments and opens the way to direct noninvasive imaging of neurons during electrical, toxin, or thermal stresses. Furthermore, neuronal activity results from both a precise control of transient variations in ionic conductances and a much less studied water exchange between the extracellular matrix and the intraaxonal compartment. The developed ionic contrast terahertz microscopy technique associated with a full three-dimensional simulation of the axon-aperture near-field system allows a precise measurement of the axon geometry and therefore the direct visualization of neuron swelling induced by temperature change or neurotoxin poisoning. Water influx as small as 20 fl per mum of axonal length can be measured. This technique should then provide grounds for the development of advanced functional neuroimaging methods based on diffusion anisotropy of water molecules.


Conflict of interest statement

Conflict of interest statement: No conflicts declared.

Figures

Fig. 1.
Fig. 1.
Amplitude absorption spectra of KCl (solid line), NaCl (dashed line), and CaCl2 (dotted line), subtracted by the spectrum of double deionized water. The concentrations are below 100 mM. Absorption is given by the amplitude molar extinction coefficient ε, defined as T/T0 = eεCl, where T and T0 are the ion and water terahertz amplitude signals, C is the ion concentration, and l is the sample thickness.
Fig. 2.
Fig. 2.
Terahertz imaging of the same axon bathed in a physiological (millimolar) solution containing increasing [K+]0: 2.5 mM (squares), 30 mM (filled circles), 50 mM (triangles), 70 mM (open circles), and 95 mM (diamonds), with an aperture diameter of 200 μm. The delay remained fixed, and the spatial stepping size was 50 μm. (Inset) Linear dependence exists between the terahertz signal and the membrane potential recorded by using intracellular microelectrodes. Figures associated to each points correspond to tested [K+]0. Vertical bars show the standard deviation of measurements on six different axons. Solid lines are fits from numerical simulations.
Fig. 3.
Fig. 3.
Imaging the neuron. (a) Two-dimensional image of an axon. The area scanned was 150 × 1,000 μm. The aperture diameter was 100 μm. Longitudinal and transverse spatial sizes were 50 μm and 10 μm, respectively. The acquisition time per point was 300 ms. The dotted line shows the half-maximum profile. (b) Deconvoluted 3D image of the axon using finite element method (FEM) simulations.
Fig. 4.
Fig. 4.
Effect of axonal Na loading. (a) Effect of Na-channel activator. Scans of neuron bathed in physiological solution before (black squares) and 2 h after (red circles) veratridine (5 μM) addition. The change in neuron profile due to veratridine is emphasize by the dotted line, which is proportional to the reference scan. The axon diameter increase ratio was 1.112 ± 0.001 (from 70 to 78 μm) and corresponds to an influx of 0.91 ± 0.01 pl/μm neuron. The aperture diameter was 100 μm, and the spatial stepping size was 10 μm. Fits (solid lines) are from FEM simulations. (b) Effect of temperature change. Axon profiles data recorded at 4°C (red circles) and 17°C (black squares). To visualize the profile change due to diameter increase when temperature rises, original data at 4°C (open circles) were also normalized (filled circles). Here, the aperture diameter was 200 μm, because the axon diameter was larger than the one in a, and the spatial stepping size was 20 μm. Line-fits were obtained from FEM simulations. (c) Axon diameter, and [K+]i and [Na+]i concentrations versus temperature, extracted from neuron profiles. The relative axon diameter increase was 1.025 ± 0.001 (from 153 to 157 μm), simultaneously with an influx of potassium and efflux of sodium. The overall water influx was 0.93 ± 0.01 pl/μm.
Fig. 5.
Fig. 5.
Setup. (a) Terahertz generation and detection with photoconductive antenna. A femtosecond pulse generates terahertz pulses, which propagate through free space, and which is detected in amplitude by the detector antenna. A chopper and lock-in device allows one to record the amplitude of the electric field, as shown in the Inset. (b) Setup for near-field microscopy with aperture. Terahertz radiation was focused onto a sub-wavelength hole by a hyper-hemispherical Teflon lens. The living tissue sample was put behind the hole, and the transmitted terahertz pulse was focused by another hemispherical lens to the photoconductive detector. Near-field distribution shows highly anisotropic electric field spatial profile at the output of the hole, computed by 3D FEM. (c) The central neural tube of L. terrestris worm was glued on a 200-μm-thick glass microscope plate (microcover glass 24 × 50 mm; Erie Scientific, Portsmouth, NH), by Vaseline seals (100 μm), bathed in a physiological solution, and covered by a second 18 × 18-mm microcover plater. Constant sample thickness was obtained by a calibrated intercalary. The composition of the physiological solution was 110.5 mM NaCl, 2.5 mM KCl, 2 mM CaCl2, and 10 mM Hepes (NaOH) buffer (pH 7.35).

References

    1. Mittleman D. in Sensing with Terahertz Radiation. Berlin: Springer; 2003.
    1. Mittleman D. M., Jacobsen R. H., Nuss M. C. IEEE J. Quantum Electron. 1996;2:679–692.
    1. Löffler T., Bauer T., Siebert K. J., Roskos H. G., Fitzgerald A., Czasch S. Opt. Exp. 2001;9:616–621. - PubMed
    1. Fitzgerald A. J., Berry E., Zinovev N. N., Walker G. C., Smith M. A., Chamberlain M. A. Phys. Med. Biol. 2002;47:R67–R84. - PubMed
    1. Woodward R. M., Cole B. E., Wallace V. P., Pye R. J., Arnone D. D., Linfield E. H., Pepper M. Phys. Med. Biol. 2002;47:3853–3863. - PubMed

LinkOut - more resources